|
FEASIBILITY OF PUMPING SCHEME TO PROVIDE WATER
FOR TECATE RIVER PARK
Victor Miguel Ponce
Professor of Civil and Environmental Engineering
San Diego State University
|
CONTENTS
1. EXECUTIVE SUMMARY |
1. EXECUTIVE SUMMARY [Top]
The feasibility of pumping treated effluent to provide water for the Tecate River Park is reported here.
The Tecate river is an ephemeral stream (arroyo or wash) and, therefore, it carries water only during heavy rains and associated floods.
The 10-yr flood has been estimated at 79 m3/s (79,000 L/s).
A certain amount of recycled water, estimated between 40 and up to 300 L/s, may be available to benefit the Tecate River Park.
The fate of this water, once delivered to the Tecate River Park, is assessed herein.
The hydraulic conductivity of the bed material in the Tecate river has been measured in-situ at six (6) sites along the study reach,
labeled in the downstream direction, from RP-1 to RP-6.
The bed material consists of poorly graded sands (SP) and fine sands with silt (SP-SM), with some exceptions.
Tests show that the hydraulic conductivity varies from high to very high.
Channel routing shows that if
the hydraulic conductivity of the streambed is very high, the delivered flows will be abstracted very quickly into the groundwater and very little of it will remain
in the surface waters.
On the other hand, if the hydraulic conductivity is high, a substantial fraction of the delivered flows
will remain in the surface water and in the vadose zone, and become available for evapotranspiration.
The RP-1 and RP-6
locations showed very high (higher) values of hydraulic conductivity, while
the RP-2 and RP-4 locations showed high (i.e., lower) values.
A suitable alternative may be a narrow (2-m wide) pilot channel,
constructed exclusively for the purpose of optimizing the permanence of surface water. This pilot channel may serve the objective of keeping the delivered
water on the surface, to more directly benefit the river park and its associated vegetation.
The surface water will directly benefit the river park by enhancing landscaping and aesthetics.
The subsurface water (vadose-zone water and groundwater) will benefit the river park through riparian vegetation.
The replenishment of groundwater will directly benefit the local aquifer.
2. BACKGROUND [Top]
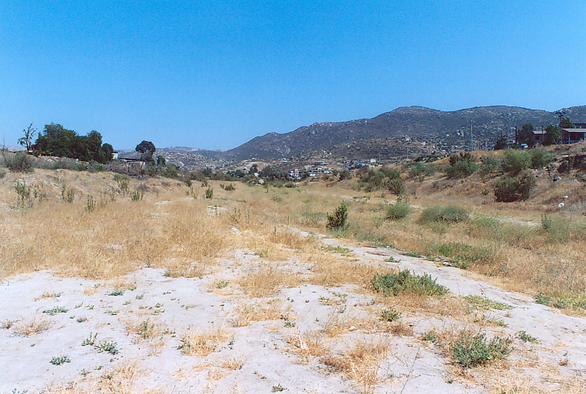
The Tecate River Park (Río Parque Tecate) is being considered to rehabilitate Arroyo Tecate, in Tecate, Baja California. The project encompasses 11 km of river, measured from the most upstream point at Puente San Jose II (Fig. 1, right arrow) to the most downstream point at Puente La Puerta (Fig. 1, left arrow).
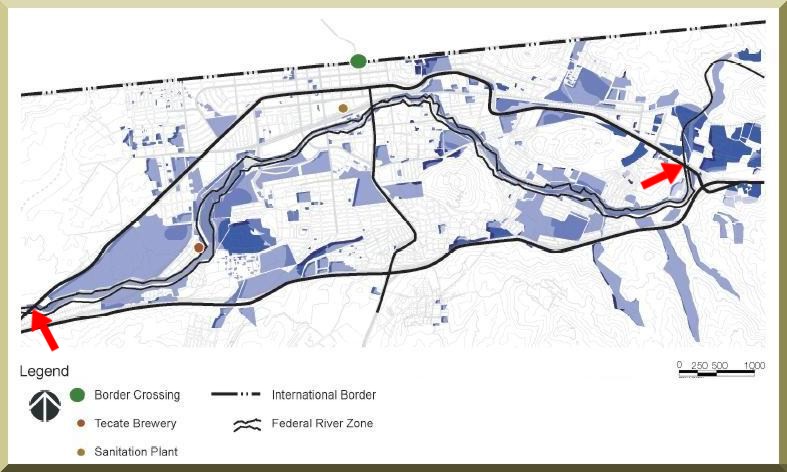
Fig. 1 Location of Tecate Rio Parque, as delimited by red arrows. |
The project considers several natural and anthropogenic functions of the river (arroyo or wash), among which the most important are:
- Mitigation of flood hazards
- Replenishment of groundwater
- Preservation and enhancement of riparian corridors
- Compliance with federal stream zoning restrictions
- Increased areas for recreation, sports, and ecotourism
- Improvement of water quality
- Preservation of biodiversity
- Enhanced landscaping and aesthetics
The project is being proposed by the Municipality of Tecate and Fundación La Puerta A.C., with support from government and private stakeholders that have a substantial role in the management of water resources in Tecate:
- Secretaría de Infraestructura y Desarrollo Urbano (SIDUE)
- Comisión Estatal de Servicios Públicos de Tecate (CESPTE)
- Cervecería Cuauhtemoc Moctezuma, S.A. (CCM)
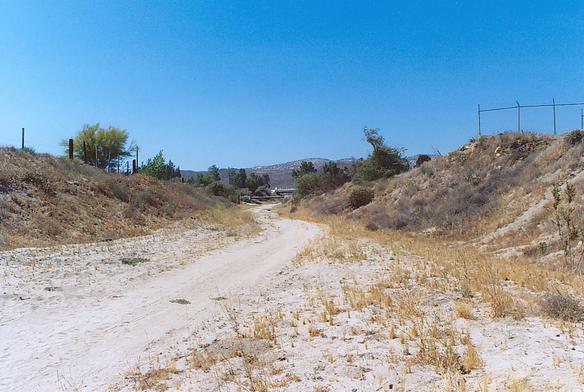
A primary concern of the project is how to provide a steady and reliable source of water to the upstream reaches. In its first 4 km, which includes El Descanso, the Tecate River lacks permanent surface water and the groundwater table is deeper than 3 m. Therefore, the riparian vegetation in this upstream reach is scarce.
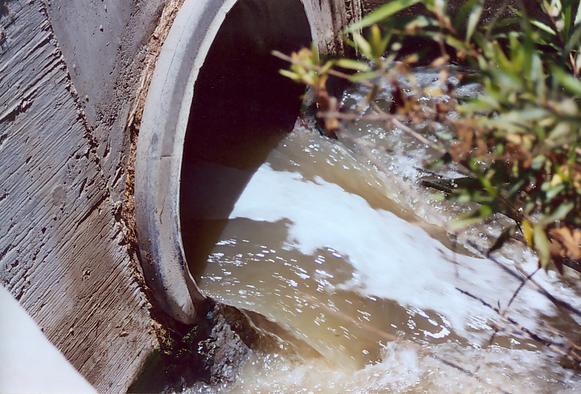
CCM is treating 20 L/s at its Planta de Tratamiento de Aguas Residuales (PTAR CCM) and discharging into the Tecate River a short distance (about 0.2 km) downstream of its manufacturing plant in Tecate. CESPTE is treating 150 L/s at its sewage treatment plant (PTAR CESPTE) and discharging into the Tecate River at the plant. Both of these flow quantities currently move downstream to join the surface and groundwater basins of the Arroyo Alamar and the Tijuana river. CESPTE expects the flow of its treatment plant to eventually reach 200 L/s by the year 2009, as urban development and sewage connections continue to spread throughout Tecate. Planning is currently underway to increase the capacity of PTAR CEPSTE to 300 L/s by the year 2020, by means of the addition of a third trickling filter tank.
The feasibility of allocating some of this reclaimed water to the Tecate River Park has been discussed. Both CCM and CESPTE have offered to pump a certain amount of treated water from their respective effluent locations, to a yet undetermined upstream location, where it would serve the purposes of the river park. While CCM has offered to provide 20 L/s, CESPTE has initially offered to provide 40 L/s. CESPTE expects to sell the remainder of the treated flow to third parties. Therefore, a total of 60 L/s has tentatively been set aside to benefit the Tecate River Park. The precise amount of water to be pumped for the Tecate River Park project remains to be determined by further study and agreement among the interested parties.
The parties have recognized that the current discharge to the Tecate river of 170 L/s (150 L/s from PTAR CESPTE plus 20 L/s from PTAR CCM) is benefiting the river and its riparian vegetation [downstream of the points of discharge]. Therefore, a certain amount of recycled water will have to remain at the present point of discharge to continue to benefit the downstream reaches, including El Rincón and vicinity.
There are many perceived benefits to the proposed pumping scheme. Among these are:
- The water will stay in Tecate and be reused in landscaping and irrigation, rather than leave the basin to benefit other downstream uses.
- The treated water will support the establishment of the river park, enhancing the quality of life of Tecate residents.
- A substantial portion of the water transferred may eventually reach the groundwater, contributing to the replenishment of the Tecate aquifer.
- The cost may be high, particularly the operation and maintenance costs.
- The fate of the pumped water is unknown, given its small quantity (40-300 L/s) compared to the carrying capacity of the river channel. For example, the 10-yr flood as determined by the Comisión Nacional del Agua (1998) is 79,000 L/s.
- Given the relatively high hydraulic conductivity of the streambed, the spatial and temporal extent of the benefits to surface water, groundwater, and the related riparian vegetation, remain to be established.
- The quality of the pumped water (Summer 2004) does not comply with applicable standards. The ongoing upgrade of PTAR CESPTE should greatly contribute to ameliorate this problem.
- Downstream habitats currently receiving the water may suffer from the routing of the water upstream.
3. OBJECTIVES [Top]
The purpose of this study is to examine the technical feasibility of the proposed pumping scheme to provide water for the Tecate River Park. The specific emphasis of this study is the hydraulic fate of the water once it is returned to the river at a predetermined location (delivery point). Accordingly, this study seeks to answer the following questions:
- What is the fate of the pumped flow once it is discharged at the delivery point? How fast will it infiltrate? How deep will it infiltrate?
- Will the pumped flow benefit surface water? To what extent?
- Will the pumped flow benefit groundwater? To what extent?
- Will the pumped flow foster the establishment of riparian vegetation?
- To what longitudinal extent will the pumped flow impact the surface water, groundwater, and vegetation resources in the proposed river park?
- What are the optimal discharge points along the channel?
4. METHODOLOGIES [Top]
4.1 Hydrology [Top]
The hydrologic component of the study aims to establish the optimum discharge that can be pumped to fulfill Tecate River Park objectives. Accordingly, a set of seven possible discharges are tested:
- 40 L/s;
- 60 L/s;
- 100 L/s,
- 150 L/s,
- 200 L/s,
- 250 L/s, and
- 300 L/s.
4.2 Hydraulics [Top]
The hydraulic component of the study aims to determine the fate of the pumped water after it is delivered to the Tecate river to benefit the River Park project. This aspect of the study consists of the following steps:
- Evaluate the hydraulic conductivity of the streambed at several locations along the Tecate river
- Design the channel cross section to convey the 10-yr flood
- Route the design flows, considering channel transmission losses, to determine flow hydrographs along the river channel
- Establish optimal volumes of discharged water and its fate.
The representative channel cross section is designed using hydraulic principles. The 10-yr flood frequency, which is the flood level used to establish the federal zone, is used for this purpose. According to the Comisión Nacional del Agua (1998), this value is 79 m3/s (79,000 L/s).
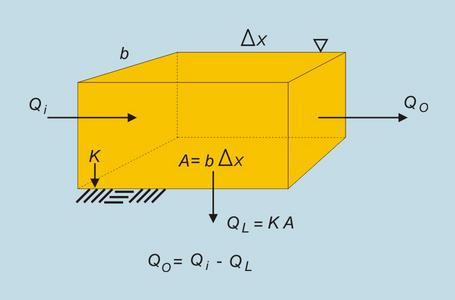
The pumping scheme will deliver a steady discharge to the upstream point or an alternative point. In the absence of infiltration (referred to in hydrology as "channel transmission losses"), the steady discharge would be routed downstream unchanged (Ponce, 1989). In the presence of infiltration, as is the case in the Tecate river, a mass balance in the control volume determines the outflow hydrograph (Fig. 38).
4.3 Vegetation [Top]
The interaction betwen the surface and groundwater and the vegetational communities is assessed through the following tasks:
- Characterization of the native and introduced vegetation in the study reach
- Survey of the quality of the vegetational communities prior to the delivery of pumped water
- Evaluation of surface-groundwater-vegetation interaction after the delivery of pumped water.
5. DATA COLLECTION [Top]
5.1 Flood discharges [Top]
The flood discharges applicable to Tecate River have been determined by the Comisión Nacional del Agua (1998). Two locations are considered for purposes of this study:
- An upstream location, immediately downstream of the intersection of Cañada Joe Bill and Arroyo San Pablo.
- A downstream location, immediately downstream of El Descanso and upstream of the Tecate urban area proper.
Table 1. Flood discharges in the study reach (CNA, 1998).
| Frequency | (yr) Upstream discharge | (m3/s) Downstream discharge | (m3/s) Adopted discharge | (m3/s) 10
| 76.3
| 81.8
| 79
| 20
| 112.2
| 124.8
| 119
| 50
| 160.9
| 183.5
| 172
| 100
| 200.6
| 231.8
| 216
| 500
| 313.7
| 369.5
| 342
| | ||||
5.2 Channel slope [Top]
The channel slope was determined from a 1:24,000 digital map produced by MapTech. The results are summarized in Table 2. The average channel slope in the study reach is 0.0067.
Table 2. Channel slopes in the study reach.
| Elevation increment | (m) Distance along the channel | (m) Slope | (m/m) 560-540
| 3645
| 0.0055
| 540-520
| 2293
| 0.0087
| 560-520
| 5938
| 0.0067
| | |||
5.3 Hydraulic conductivity [Top]
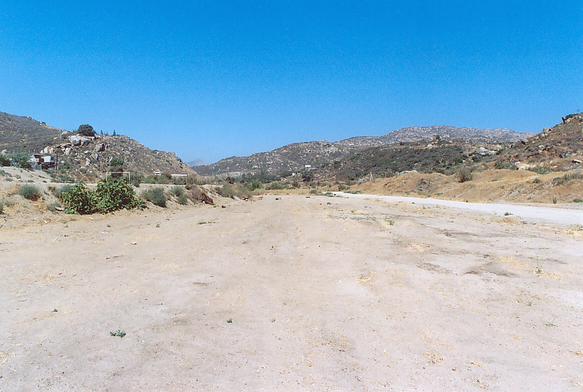
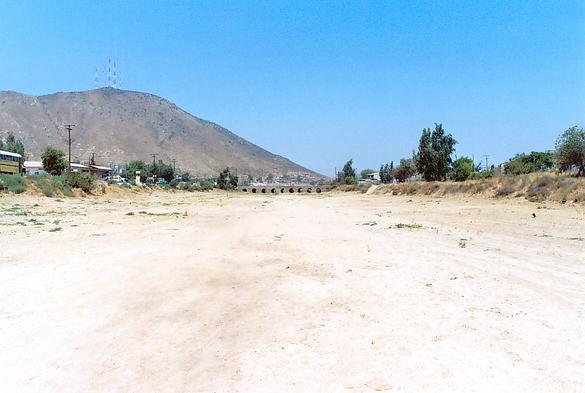
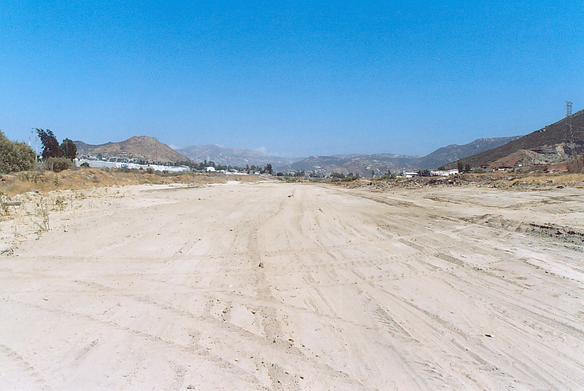
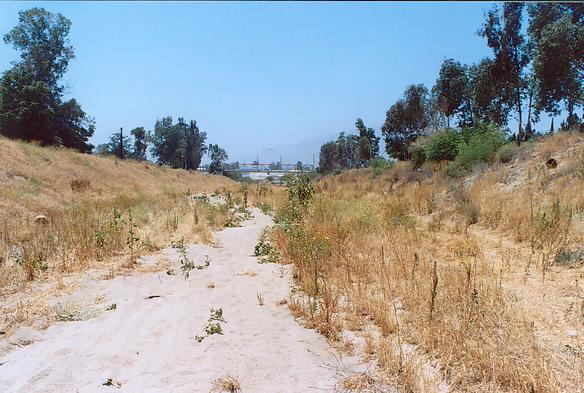
The hydraulic conductivity of the streambed of Tecate Creek was assessed with field measurements. Eighteen field tests were carried out in six sites located along the streambed as shown in Fig. 2 (three tests at each site). Test locations are numbered from RP-1 in the vicinity of Puente San Jose II, to RP-6 in the vicinity of Cervecería Cuauhtemoc Moctezuma (see Table 3). This is considered to be the furthest downstream point for the pumping scheme, which is intended to primarily benefit the upper reaches of the Tecate river (RP-1 to RP-5 sites).
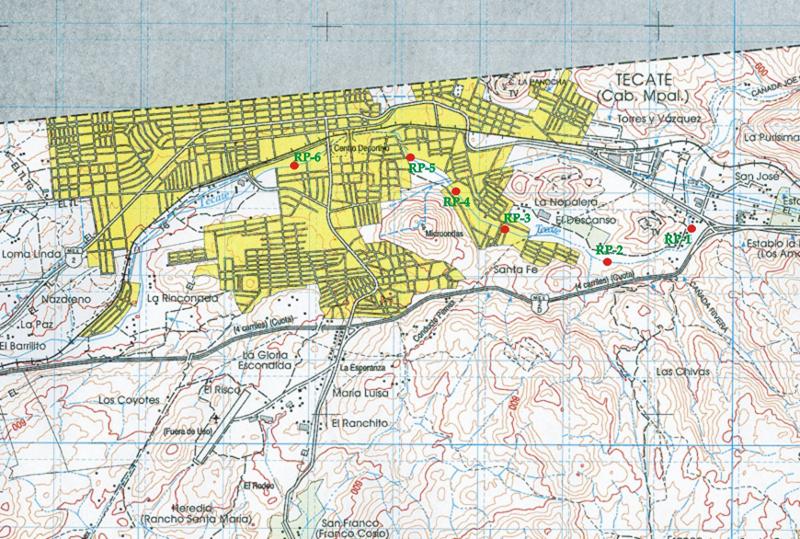
Fig. 2 Location of sites to measure field hydraulic conductivity. |
Table 3. Geographical coordinates of test locations.
| Location
| Latitude
| Longitude
| RP-1
| 32o 33.664' N
| 116o 34.796' W
| RP-2
| 32o 33.492' N
| 116o 35.454' W
| RP-3
| 32o 33.690' N
| 116o 36.145' W
| RP-4
| 32o 33.907' N
| 116o 36.547' W
| RP-5
| 32o 34.157' N
| 116o 36.928' W
| RP-6
| 32o 34.114' N
| 116o 37.800' W
| | |||
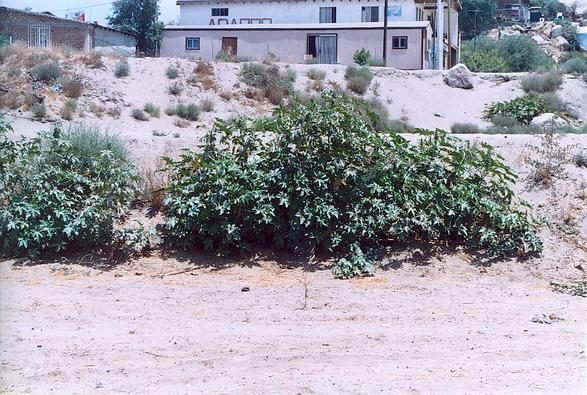
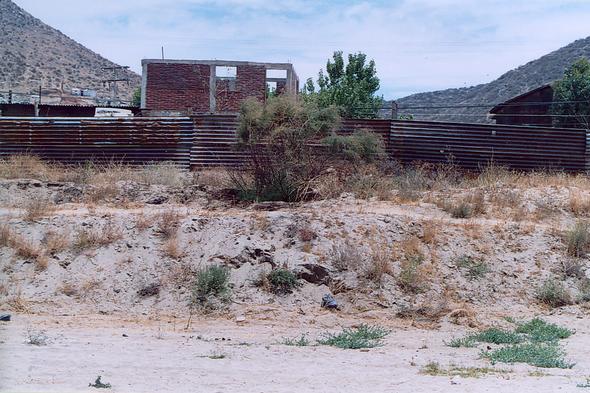
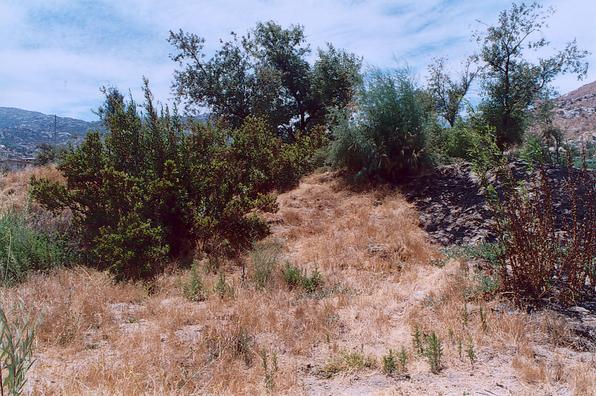
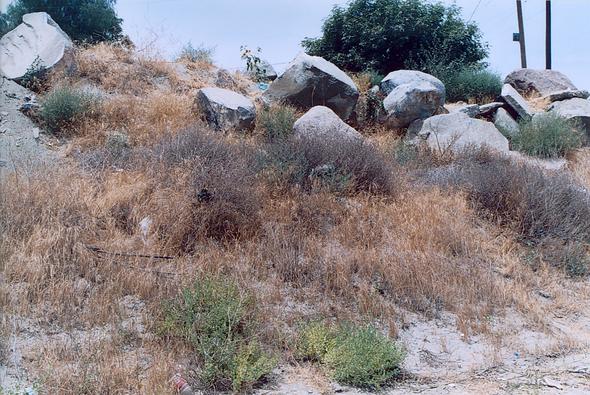
Figures 3 to 8 show the Tecate River channel in the vicinity of the test locations. The considerable variability of the channel width is particularly noted. The geometric properties of the actual cross sections are shown in Table 4.
|
|
|
|
|
|
Table 4. Geometric properties of actual cross sections.
| Location
| Bottom width | (m) Top width | (m) Depth | (m) RP-1
| 17.0
| 27.0
| 2.5
| RP-2
| 78.0
| 88.8
| 3.2
| RP-3
| 37.0
| 42.0
| 2.5
| RP-4
| 43.0
| 63.0
| 5.0
| RP-5
| 30.0
| 42.0
| 3.0
| RP-6
| 12.0
| 28.0
| 4.0
| | |||
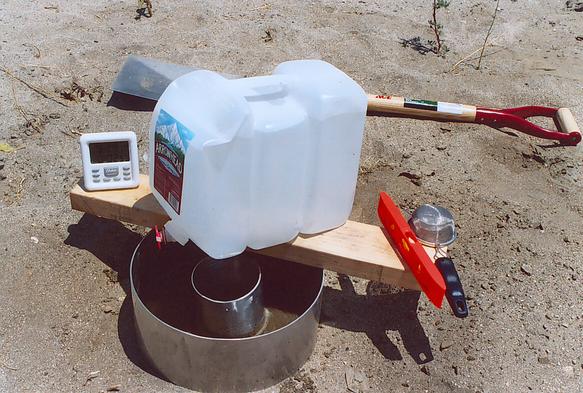
The equipment used to measure hydraulic conductivity in the field is shown in Fig. 9.
A known volume of water V (Table 5, Column 2)
is poured in the inner cylinder (of cross-sectional area A =83.97 cm2)
while maintaining an equivalent head of water in the outer cylinder.
The time T for percolation of the water in the inner cylinder is measured (Table 5, Column 3).
The hydraulic conductivity is calculated as follows:
K = (V /T ) / A .
The results of the tests are shown in Table 5. These are initial values rather than final, i.e., steady-state values and, therefore, are somewhat higher than values of effective hydraulic conductivity (Horton, 1933).
|
Table 5. Results of field hydraulic conductivity tests.
| Location | (RP) Volume | (cm3) Time
| Hydraulic conductivity
| Classification by U.S.C.S.
| (m/s)
| (cm/s)
| (cm/h)
| 1-A
| 500
| 01' 53"
| 0.0005270
| 0.05270
| 189.7
| Poorly graded sand (SP)
| 1-B
| 500
| 02' 21"
| 0.0004223
| 0.04223
| 152.0
| Poorly graded sand (SP)
| 1-C
| 500
| 01' 29"
| 0.0006690
| 0.06690
| 240.9
| Poorly graded sand (SP)
| 1
| -
| -
| 0.0005390
| 0.05390
| 194
| SP
| 2-A
| 500
| 39' 05"
| 0.0000254
| 0.00254
| 9.14
| Fine sand with silt (SM)
| 2-B
| 300
| 18' 46"
| 0.0000317
| 0.00317
| 11.42
| Fine sand with silt (SW-SM)
| 2-C
| 300
| 32' 23"
| 0.0000183
| 0.00183
| 6.62
| Fine sand with silt (SM)
| 2
| -
| -
| 0.0000251
| 0.00251
| 9.04
| SM and SW-SM
| 3-A
| 500
| 01' 30"
| 0.0006616
| 0.06616
| 238.2
| Poorly graded sand (SP)
| 3-B
| 500
| 16' 47"
| 0.0000591
| 0.00591
| 21.29
| Fine sand with silt (SM)
| 3-C
| 500
| 17' 47"
| 0.0000558
| 0.00558
| 20.09
| Fine sand with silt (SM)
| 3
| -
| -
| 0.0002590
| 0.02590
| 93.2
| SM and SP
| 4-A
| 300
| 35' 30"
| 0.0000167
| 0.00167
| 6.04
| Fine sand with silt (SW-SM)
| 4-B
| 300
| 03' 14"
| 0.0001842
| 0.01842
| 66.3
| Well graded sand (SW)
| 4-C
| 500
| 18' 23"
| 0.0000540
| 0.00540
| 19.43
| Fine sand with silt (SW-SM)
| 4
| -
| -
| 0.0000850
| 0.00850
| 30.6
| SW-SM and SW
| 5-A
| 300
| 45' 30"
| 0.0000131
| 0.00131
| 4.71
| Fine sand with clay (SC)
| 5-B
| 500
| 01' 58"
| 0.0005046
| 0.05046
| 181.7
| Well graded sand (SW)
| 5-C
| 500
| 05' 07"
| 0.0001940
| 0.01940
| 69.8
| Well graded sand (SW)
| 5
| -
| -
| 0.0002370
| 0.02370
| 85.3
| SW and SC
| 6-A
| 500
| 00' 19"
| 0.0031339
| 0.31339
| 1128.2
| Poorly graded sand (SP)
| 6-B
| 500
| 01' 38"
| 0.0006076
| 0.06076
| 218.7
| Poorly graded sand (SP)
| 6-C
| 500
| 00' 46"
| 0.0012944
| 0.12944
| 466.0
| Poorly graded sand (SP)
| 6
| -
| -
| 0.0016800
| 0.16800
| 605
| SP
| | ||||||||
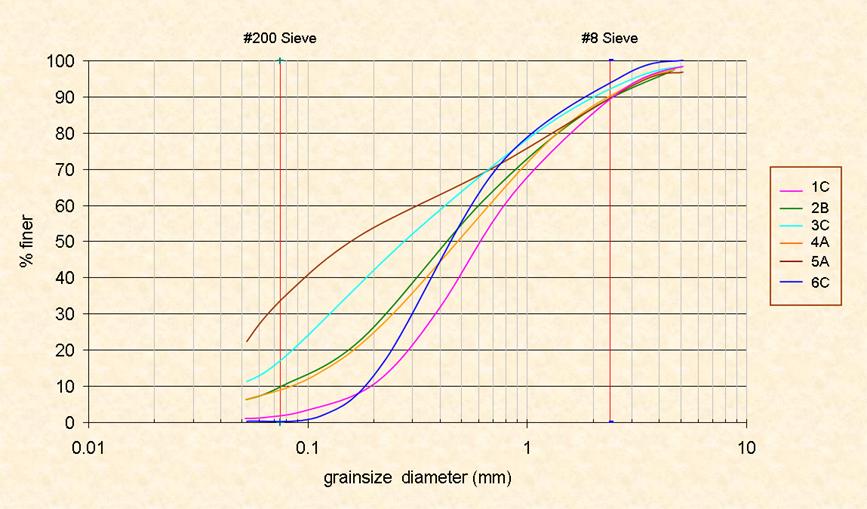
Figure 10 shows the results of grainsize analysis. The USCS classifications (SP, SW, SW-SM, SM and SC) are confirmed by the analysis. Samples from locations 2, 3, 4 and 5 have an appreciable amount of fines.
|
The USDA Natural Resources Conservation Service specifies values of effective hydraulic conductivity in Chapter 19 of their National Engineering Handbook No. 4 - Hydrology (NRCS, 1993). Effective hydraulic conductivity represents a space-time average infiltration rate, incorporating the influence of temperature, sediment concentration, flow irregularities, errors in the data, and variations in wetted area. This table, shown here as Table 6, is used to estimate hydraulic conductivity in the absence of field measurements.
| Table 6. Effective hydraulic conductivity vs. bed material
characteristics (USDA NRCS, 1993). Description
| Bed material characteristics
| Effective hydraulic conductivity
| (in/h) |
(cm/h) |
Very high loss rate
| Very clean gravel and large sand
| Greater than 5
| Greater than 12.7
| High loss rate
| Clean sand and gravel
| 2 - 5
| 5.08 - 12.7
| Moderately high loss rate
| Sand and gravel mixture with low silt-clay content
| 1 - 3
| 2.54 - 7.62
| Moderate loss rate
| Sand and gravel mixture with high silt-clay content
| 0.25 - 1
| 0.635 - 2.54
| Insignificant to low loss rate
| Consolidated bed material with high silt-clay content
| 0.001 - 0.1
| 0.00254 - 0.254
| | |||||
Given Table 6, the following conclusions are obtained from the hydraulic conductivity tests:
- The hydraulic conductivity of sites RP-1 and RP-6 is very high, which indicates poorly graded sands (SP).
- The hydraulic conductivity of site RP-2 is high, which indicates fine sands with silt (SW-SM).
- The hydraulic conductivity of site RP-3, RP-4 and RP-5 varies from high to very high, which indicates a combination of poorly graded sands (SP), fine sand with silt (SW-SM), and fine sand with appreciable silt or clay (SM or SC).
5.4 Depth to groundwater [Top]
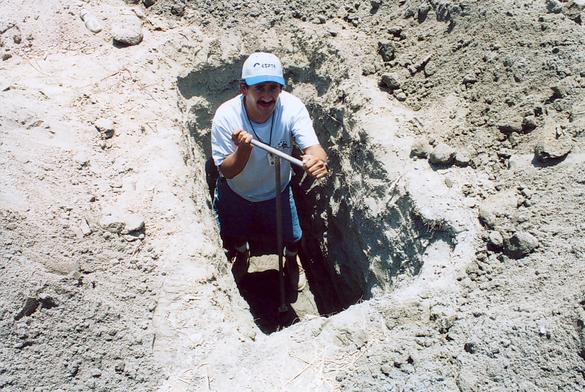
Four field borings were carried out to explore the depth to groundwater along the Tecate river. These tests were carried out on June 22, 2004 on sites RP-1, RP-3, RP-5, and RP-6. The pits were excavated by hand (shovel) to a depth of 1.5 m, and then by auger to a depth of 3 m (Fig. 11). The results are shown in Table 7.
Table 7. Borings to determine depth to groundwater.
| Location | Visual classification
| Unified soil classification
| Comments
| RP-1
| Poorly graded sand
| SP
| Dry sand; no presence of groundwater.
| RP-3
| Fine sand with silt
| SM
| Moist sand; no presence of groundwater.
| RP-5
| Well graded sand
| SW
| Some moisture at 3-m depth.
| RP-6
| Poorly graded sand
| SP
| Substantial moisture at 3-m depth.
| | ||||
The results shown in Table 7 enable the following conclusions:
- The water table is at a depth greater than 3 m in the upstream reaches (in the vicinity of RP-1 and RP-3).
- The water table is at a depth near 3 m in the downstream reaches (in the vicinity of RP-5 and RP-6).
- The further downstream, the closer the water table is to the surface. This explains the near absence of riparian vegetation in the vicinity of RP-1 to RP-3, and the substantial presence of riparian vegetation downstream of RP-5 and upstream of RP-6.
|
5.5 Vegetation survey [Top]
The vegetation of the Tecate river consists of riparian communities, which typically establish themselves in the banks of the river and draw their water requirements primarily from subsurface water, including the vadose-zone and groundwater. With the passage of time, these riparian communities may be subject to alterations which are driven by the depletion of groundwater, surface erosion, or dynamical processes such as aggradation and degradation.
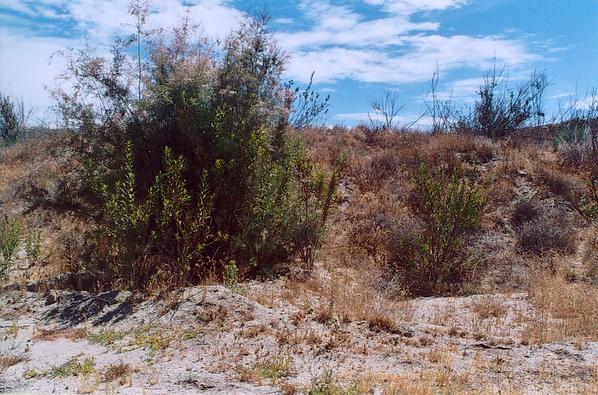
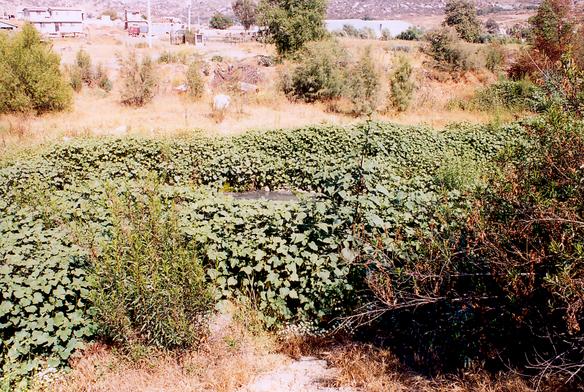
The study reach, from RP-1 to RP-5, a distance of about 4 km (El Descanso), has very little riparian vegetation. This is attributed to the fact that the water table is usually at a depth greater than 3 m. The representative species are: willows [sauce] (Salix spp.), saltcedar [pino salado] (Tamarix ramosissima), seep willow [huatamote] (Baccharis glutinosa), and giant stinging nettle [ortiguilla] (Urtica holosericea) (Fig. 12).The existing sparse woody vegetation is scattered throughout, as shown in Figs. 13 to 17.
![Flower of the seep willow [huatamote]](trees_huatamote.jpg)
|
![Flower of the giant stinging nettle [ortiguilla]](trees_ortiguilla.jpg)
|
The existing vegetation is subject to a high degree of disturbance, from anthropogenic pressures and management actions designed to remove portions of the vegetation in order to increase the conveyance of the river during the annual floods. The removal of riparian vegetation may increase conveyance, but it is usually at the expense of increased erosion and sediment transport and, more importantly, decreased replenishment of groundwater.
|
|
|
|
|
Downstream of RP-5, there is a sudden increase in vegetation density, represented by species such as willows [sauce] (Salix spp.) (Fig. 18) and saltcedar [pino salado] (Tamarix ramosissima) (Fig. 19).
Currently, the only substantial vegetation communities in the study reach are those that can benefit directly from the close presence of groundwater. The River Park project is likely to increase both vadose-zone moisture and groundwater levels, which would benefit the establishment of naturally occurring native vegetation and landscaping for the Tecate River Park.
![A community of willows [sauce] (Salix spp.), growing in the Tecate river bed, immediately downstream of RP-5.](tecate_rio_parque_photo_sauce.jpg)
|
![A specimen of saltcedar [pino salado], growing along the banks of the Tecate river, downstream of RP-5.](tecate_rio_parque_photo_pino_salado.jpg)
|
The ideal time to plant is the second month of the rainy season, usually November. At other times, irrigation will be necessary to aid in vegetation establishment. Table 8 is a comprehensive list of species that are recommended for the Tecate River Park. If properly managed, the riparian vegetation will develop into a gallery forest, which will provide improved landscaping and aesthetics to the local community. The ensuing microclimate, wetter and cooler that the surrounding neighborhoods, will enhance the quality of life for Tecate residents.
Table 8. Proposed vegetative species for the Tecate River Park
(Delgadillo, 2004).
| Common name in | Spanish Common name in English | [Click to display photo] Scientific name
| Features
| Acacia
| Acacia
| Acacia spp.
| Short tree
| Alamo
| Cottonwood, poplar
| Populus spp.
| Tall tree, phreatic, seasonal shedding of leaves
| Alamillo
| Kurrajong
| Brachyton populneus
| Medium tree, perennial leaves
| Algarrobo
| Carob
| Ceratonia siliqua
| Short tree
| Aliso
| Sycamore
| Platanus racemosa
| Tall tree, phreatic, seasonal shedding of leaves
| Arce
| Norway maple
| Acer platanoides
| Medium tree, seasonal shedding of leaves
| Ceiba
| Ceiba
| Ceiba spp.
| Short tree, orange flowers
| Pochote, | cedro espino Prickly cedar
| Bombacopsis quinata
| Short tree, orange flowers
| Fresno
| Tropical ash, Mexican ash
| Fraxinus uhdei
| Medium tree, phreatic, seasonal shedding of leaves
| Gingko
| Gingko
| Ginkgo biloba
| Medium tree, open, seasonal shedding of leaves
| Jacaranda
| Brazilian rosewood
| Jacaranda mimosifolia
| Medium tree, open, with flowers
| Magnolia
| Southern magnolia
| Magnolia grandiflora
| Medium to high tree, with flowers
| Melaleuca
| Punk tree, Paperbark tree
| Melaleuca quinquenervia
| Medium tree, 5-7 m tall
| Olmo
| Chinese elm
| Ulmus parviflora
| Medium tree, seasonal shedding of leaves
| Orquídea de arbol
| Bauhinia
| Bauhinia divaricata
| Medium tree, open, rose-color flowers
| Pata de vaca
| Redbud, Eastern redbud
| Cercis canadensis
| Medium tree, wide top, rose-color flowers
| Pino australiano
| New Zealand's totora
| Podocarpus totora
| Medium tree
| Pino canario
| Canary Island pine
| Pinus canariensis
| Tall tree
| Pino de seda
| Silky oak
| Grevillea robusta
| Medium tree
| Piocha
| Chinaberry
| Melia azedarach
| Medium tree, seasonal shedding of leaves
| Sauce
| Willow
| Salix spp.
| Short tree, phreatic, seasonal shedding of leaves
| Sauco
| Blue elderberry, Mexican elder
| Sambucus mexicana
| Medium tree, with flowers
| Tabachín
| Red bird of paradise
| Caesalpinia pulcherrima
| Medium to high tree, with flowers
| Tecoma
| Yellow bells
| Tecoma stans
| Medium tree, with flowers
| Trueno
| Glossy privet
| Ligustrum lucidum
| Short tree
| | |||
5.6 PTAR CESPTE water quality [Top]
Currently (September 2004), the water quality of PTAR CESPTE is not in compliance with Mexican regulations. Mexican regulations for biochemical oxygen demand (BOD5) establish a maximum of 75 mg/L for effluent discharge to rivers (NOM-001-SEMARNAT-1998) and 30 mg/L for recycled water use (NOM-003-SEMARNAT-1998).
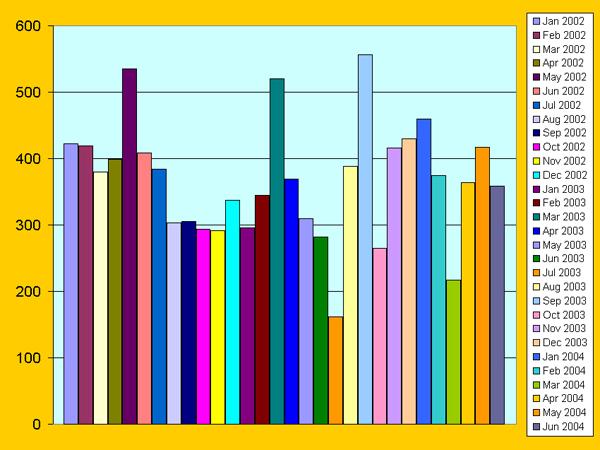
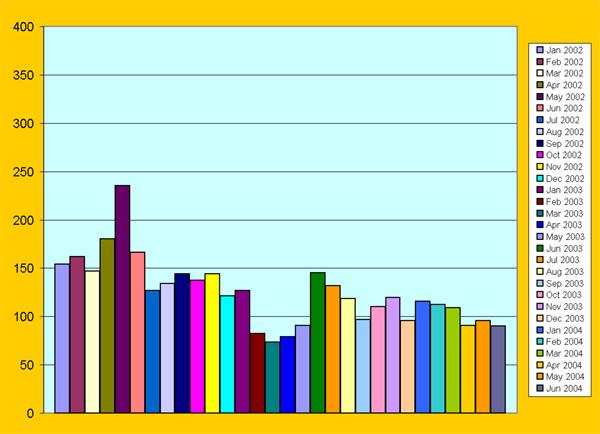
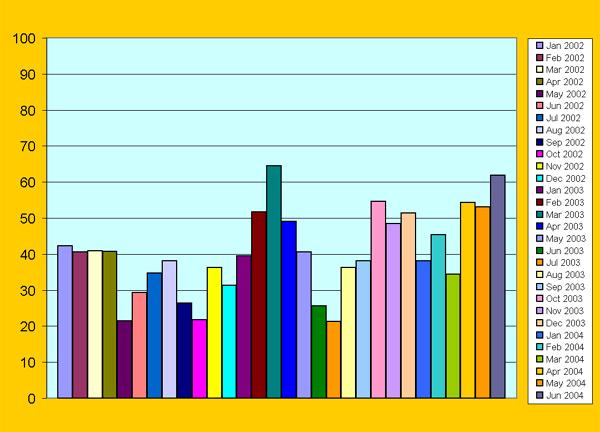
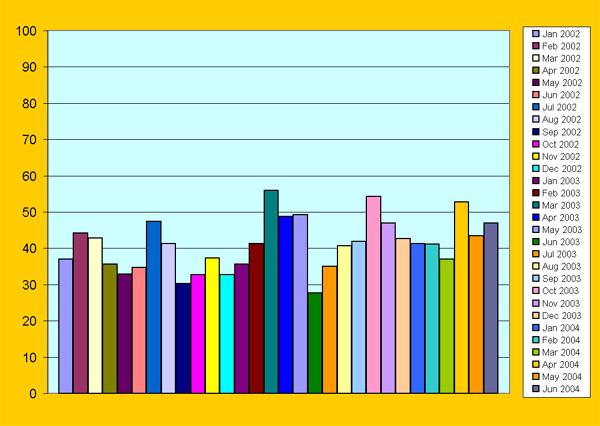
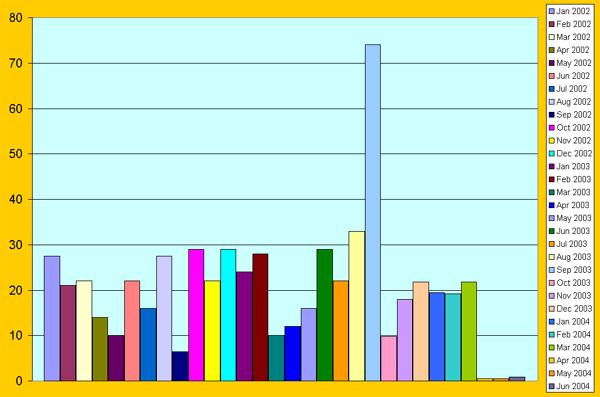
Laboratory tests spanning the 30-month period from January 2002 to June 2004 show the current efficiency of BOD5 removal (CESPTE, 2004a). Figure 20 shows the influent BOD5, Fig. 21 shows the effluent BOD5, and Fig. 22 shows the BOD5 removal efficiency at PTAR CESPTE. The average effluent BOD5 for the record period is 183 mg/L. The average BOD5 removal efficiency for the 30-month study period is 50.7%.
|
|
|
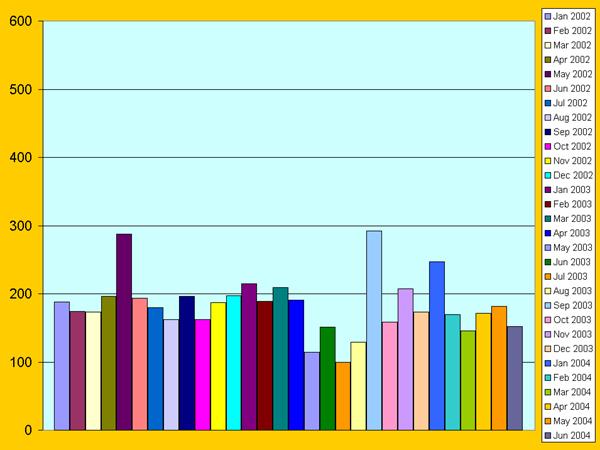
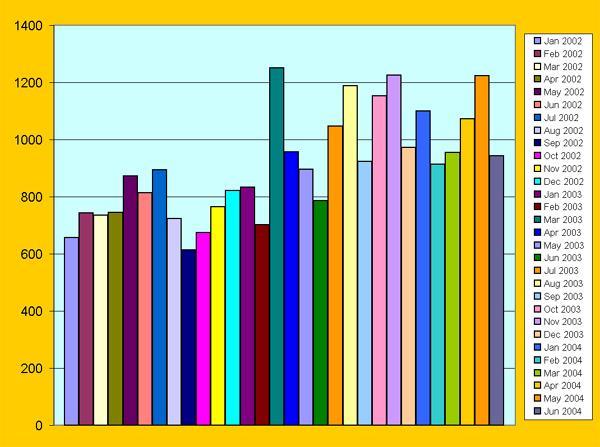
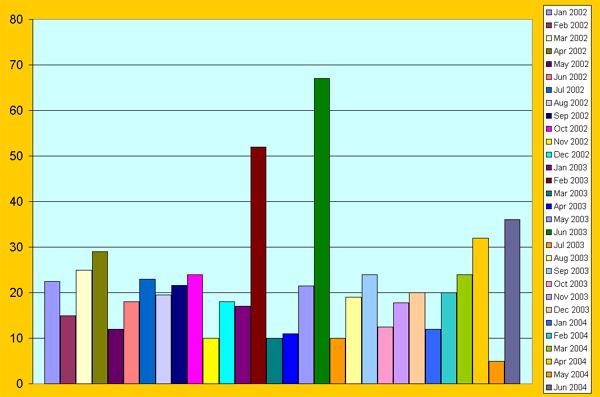
Figure 23 shows the influent total suspended solids (TSS), Fig. 24 shows the effluent TSS, and Fig. 25 shows the TSS removal efficiency at PTAR CESPTE. The average effluent TSS is 125 mg/L. Mexican regulations for TSS establish a maximum of 75 mg/L. The average TSS removal efficiency for the 30-month study period is 41.8%.
|
|
|
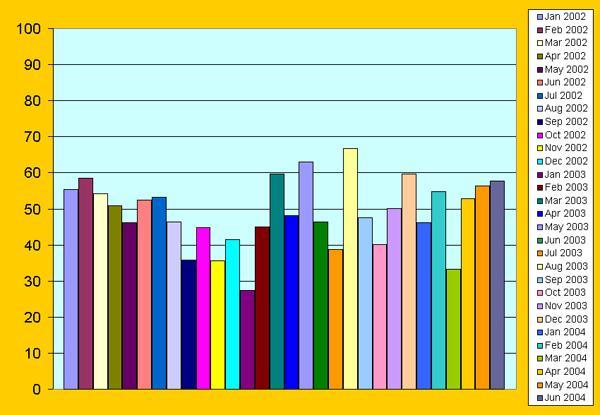
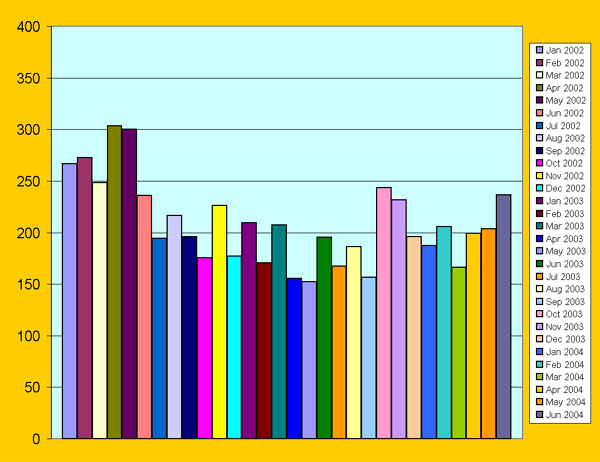
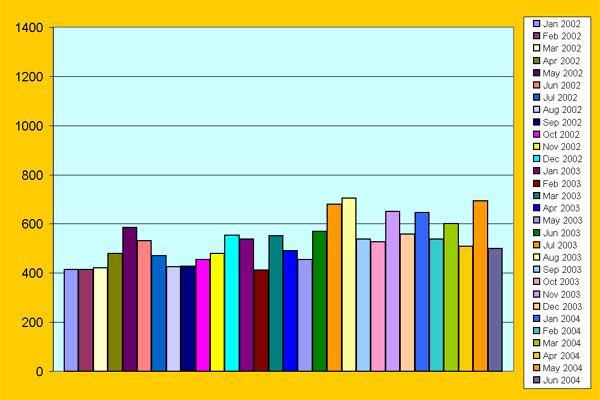
Figure 26 shows the influent chemical oxygen demand (COD), Fig. 27 shows the effluent COD, and Fig. 28 shows the COD5 removal efficiency at PTAR CESPTE. The average COD removal efficiency for the 30-month study period is 42.5%.
|
|
|
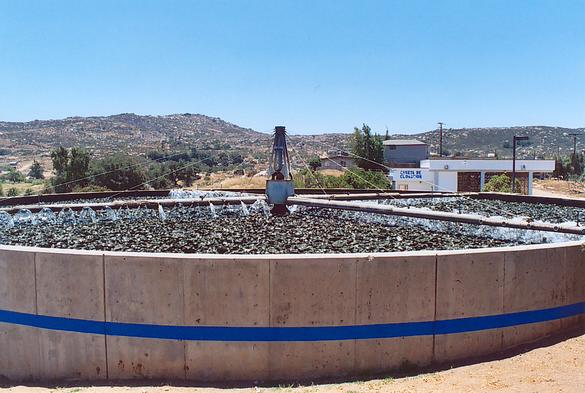
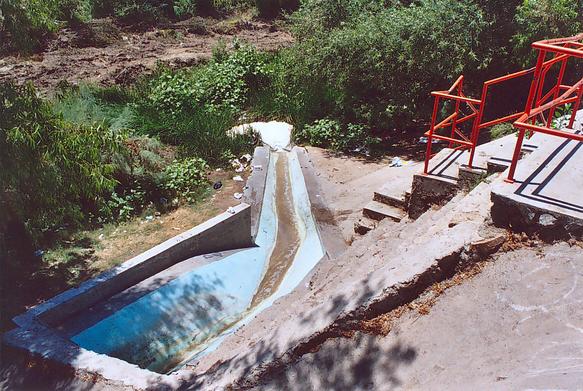
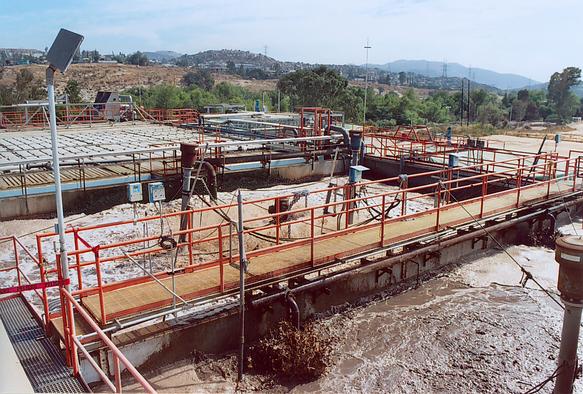
Clearly, an upgrade of PTAR CESPTE is necessary to treat the effluent (Figs. 29 and 30) to comply with federal regulations. The ongoing Phase 1 upgrade, scheduled to be completed by 2005, centers on the replacement of the filter material in the two trickling filter tanks (Fig. 31). This upgrade should reduce the effluent BOD quality to less than 30 mg/L, which will comply the Mexican regulation NOM-003-SEMARNAT-1998 for recycled water use. In addition, PTAR CESPTE has in place a program of effluent control based on NOM-002-SEMARNAT-1998. This program features monitoring, vigilance and identification of point sources of industrial pollution. These programs are expected to increase the quality of treated effluent and make it safer to discharge into the proposed River Park.
|
|
|
5.7 PTAR CCM water quality [Top]
The effluent quality at PTAR CCM is very good to excellent, judging from the summary results of the last three months of record, reported in Table 9. Figures 32 and 33 show the BOD and TSS effluent values for the 30-month period from January 2002 to June 2004. These figures show that in the past three months, PTAR CCM has considerably improved its effectiveness in treating the industrial effluent of the CCM plant (Figs. 34 and 35). Mexican regulations for both BOD5 and TSS establish a maximum of 75 mg/L (NOM-002). The quantity of treated water is currently 19-20 L/s, which may be available for pumping to provide water for the Tecate River Park (unless it is decided to continue to discharge at the current discharge location).
Table 9. Water quality of effluent at PTAR CCM (CCM, 2004).
| Date of Sample
| BOD5 | (mg/L) TSS | (mg/L) April 14, 2004
| < 0.5
| 32
| May 6, 2004
| < 0.9
| < 5
| June 2, 2004
| < 0.9
| 36
| | ||||
|
|
|
|
6. ANALYSIS [Top]
6.1 Typical cross section [Top]
It is envisioned that the river channel in the Tecate River Park will feature a 10-yr flood control channel to convey 79 m3/s. This channel is to be contained within a much larger 500-yr flood control channel, designed to convey 342 m3/s (Table 1).
For the purposes of this study, which deals specifically with the pumped flows, the typical cross section for flood control is a trapezoidal channel of design discharge 79 m3/s and bottom slope 0.0067. The sides slopes are taken as 2 horizontal to 1 vertical, a customary design value for general application. The Manning's n friction coefficient is assumed to be 0.05, a value which takes into account the presence of riparian vegetation, an avowed feature of the proposed river park.
The study reach length is taken as 4000 m, from the upstream point at Puente San Jose II (in the vicinity of the RP-1 location) to the downstream point near urban Tecate proper (in the vicinity of the RP-5 location).
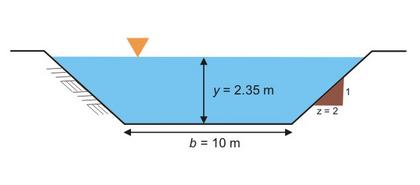
For a channel with discharge Q = 79 m3/s, bottom width b = 10 m, side slope z = 2, Manning's n = 0.05, and bottom slope So = 0.0067, the calculated flow depth using the Manning equation is y = 2.34 m (Fig. 36). A flow depth of y = 2.35 m is assumed, which will convey a discharge of 80 m3/s.
|
For comparison, the design flow depths for seven discharge levels considered in the pumping scheme are shown in Table 10. It is seen that the pumped flows are a small fraction of the design flood discharge (79 m3/s). The flow depths vary between 27 and 90 mm.
Table 10. Design flow depths in typical cross section.
| Discharge level | Discharge | (L/s) Flow depth
| (m)
| (mm)
| I
| 40
| 0.027
| 27
| II
| 60
| 0.035
| 35
| III
| 100
| 0.047
| 47
| IV
| 150
| 0.060
| 60
| V
| 200
| 0.071
| 71
| VI
| 250
| 0.081
| 81
| VII
| 300
| 0.090
| 90
| | |||||
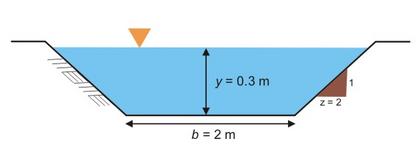
The flow depths calculated in Table 10 are very small; therefore, the associated large surface area is likely to readily abstract the surface flows into the groundwater (Section 6.3). To reduce the surface area to the extent possible, a feasible alternative may be to construct a pilot channel of bottom width b = 2 meters, solely for the purposes of optimizing the quantity of surface water, i.e., keeping the water as surface water as long as possible. The design discharge for this pilot channel is 300 L/s.
For a channel with discharge Q = 0.3 m3/s (300 L/s), bottom width b = 2 m, side slope z = 2, Manning's n = 0.05, and bottom slope So = 0.0067, the calculated flow depth using the Manning equation is y = 0.23 m. A design flow depth of y = 0.3 m is assumed herein. This flow depth will convey a discharge of 0.488 m3/s, or 488 L/s (Fig. 37).
|
6.2 Design hydraulic conductivity [Top]
The hydraulic conductivity measured in the field approximates an initial value and is, therefore, generally higher than effective values, as documented by USDA NRCS (1993). For purpose of this study, design values of hydraulic conductivity are selected based on field and handbook data (Tables 5 and 6). Two values are selected for design:
- A high value KA = 0.00001 m/s, equivalent to 3.6 cm/h, applicable in the vicinity of sites RP-2 and RP-4.
- A very high value KB = 0.0001 m/s, equivalent to 36 cm/h, applicable in the vicinity of sites RP-1 and RP-6.
6.3 Channel routing [Top]
The purpose of the channel routing is to determine the inflow and outflow hydrographs through several subreaches of the study reach. The length of the study reach is 4000 m. Five (5) subreaches are considered for purposes of this study, each with length of 800 m. The methodology calls for the routing of seven (7) discharge levels (40, 60, 100, 150, 200, 250, and 300 L/s) through five (5) subreaches, and the calculation of an outflow hydrograph at the end of each subreach. This procedure enables the separation of the pumped discharge into surface water and subsurface water. The latter consists of vadose water and groundwater.
Given the small flow depths (see Table 10), for each subreach it is assumed that the infiltration area is approximately equal to the subreach length (800 m) times the bottom width (10 m), which results in A = 8000 m2. Therefore, through one typical subreach, the infiltration discharge is:
- For the high hydraulic conductivity case (KA = 0.00001 m/s): QA = 0.08 m3/s, or 80 L/s.
- For the very high case (KB = 0.0001 m/s): QB = 0.8 m3/s, or 800 L/s.
|
Table 11 shows the routed flows for the 10-m wide flood control channel, from the upstream end at km 0+000 to the downstream end at km 4+000, for seven levels of discharge and two levels of hydraulic conductivity.
Table 11. Routed flows for the flood control channel,
at the downstream end of five subreaches.
| A. High hydraulic conductivity (KA = 0.00001 m/s)
| Discharge level | Inflow discharge | (L/s) Subreach 1 (km 0+800) | (L/s) Subreach 2 (km 1+600) | (L/s) Subreach 3 (km 2+400) | (L/s) Subreach 4 (km 3+200) | (L/s) Subreach 5 (km 4+000) | (L/s) I | 40
| 0
| 0
| 0
| 0
| 0
| II | 60
| 0
| 0
| 0
| 0
| 0
| III | 100
| 20
| 0
| 0
| 0
| 0
| IV | 150
| 70
| 0
| 0
| 0
| 0
| V | 200
| 120
| 40
| 0
| 0
| 0
| VI | 250
| 170
| 90
| 10
| 0
| 0
| VII | 300
| 220
| 140
| 60
| 0
| 0
| B. Very high hydraulic conductivity (KB = 0.0001 m/s)
| Discharge level | Inflow discharge | (L/s) Subreach 1 (km 0+800) | (L/s) Subreach 2 (km 1+600) | (L/s) Subreach 3 (km 2+400) | (L/s) Subreach 4 (km 3+200) | (L/s) Subreach 5 (km 4+000) | (L/s) I | 40
| 0
| 0
| 0
| 0
| 0
| II | 60
| 0
| 0
| 0
| 0
| 0
| III | 100
| 0
| 0
| 0
| 0
| 0
| IV | 150
| 0
| 0
| 0
| 0
| 0
| V | 200
| 0
| 0
| 0
| 0
| 0
| VI | 250
| 0
| 0
| 0
| 0
| 0
| VII | 300
| 0
| 0
| 0
| 0
| 0
| | ||||||||||||||||||
For the case of the 2-m wide pilot channel, for each subreach it is assumed that the infiltration area is approximately equal to the subreach length (800 m) times the bottom width (2 m), which results in A = 1600 m2. Therefore, through one typical subreach, the infiltration discharge is:
- For the high hydraulic conductivity case (KA = 0.00001 m/s): QA = 0.016 m3/s, or 16 L/s.
- For the very high case (KB = 0.0001 m/s): QB = 0.16 m3/s, or 160 L/s.
Table 12 shows the routed flows for the 2-m wide pilot channel, from the upstream end at km 0+000 to the downstream end at km 4+000, for seven levels of discharge and two levels of hydraulic conductivity.
Table 12. Routed flows for the pilot channel,
at the downstream end of five subreaches.
| A. High hydraulic conductivity (KA = 0.00001 m/s)
| Discharge level | Inflow discharge | (L/s) Subreach 1 (km 0+800) | (L/s) Subreach 2 (km 1+600) | (L/s) Subreach 3 (km 2+400) | (L/s) Subreach 4 (km 3+200) | (L/s) Subreach 5 (km 4+000) | (L/s) I | 40
| 24
| 8
| 0
| 0
| 0
| II | 60
| 44
| 28
| 12
| 0
| 0
| III | 100
| 84
| 68
| 52
| 36
| 20
| IV | 150
| 134
| 118
| 102
| 86
| 70
| V | 200
| 184
| 168
| 152
| 136
| 120
| VI | 250
| 234
| 218
| 202
| 186
| 170
| VII | 300
| 284
| 268
| 252
| 236
| 220
| B. Very
high hydraulic conductivity (KB = 0.0001 m/s)
| Discharge level | Inflow discharge | (L/s) Subreach 1 (km 0+800) | (L/s) Subreach 2 (km 1+600) | (L/s) Subreach 3 (km 2+400) | (L/s) Subreach 4 (km 3+200) | (L/s) Subreach 5 (km 4+000) | (L/s) I | 40
| 0
| 0
| 0
| 0
| 0
| II | 60
| 0
| 0
| 0
| 0
| 0
| III | 100
| 0
| 0
| 0
| 0
| 0
| IV | 150
| 0
| 0
| 0
| 0
| 0
| V | 200
| 40
| 0
| 0
| 0
| 0
| VI | 250
| 90
| 0
| 0
| 0
| 0
| VII | 300
| 140
| 0
| 0
| 0
| 0
| | ||||||||||||||||||
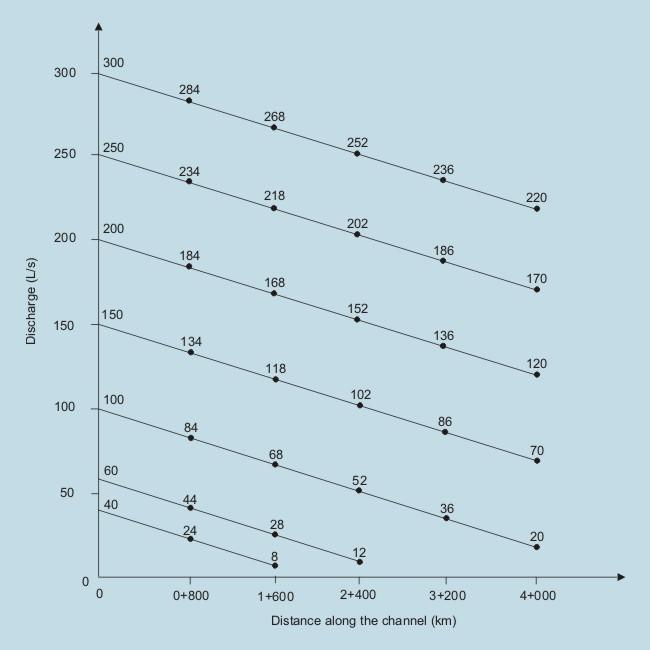
The results of flow routing in the pilot channel for the case of high hydraulic conductivity are shown in Fig. 39.
|
6.4 Groundwater replenishment [Top]
Under conditions of very high hydraulic conductivity, most of the water that infiltrates into the ground eventually joins the Tecate River aquifer. In this case, water volumes joining the aquifer are shown in Table 13. The annual volumes assume that the pumping is continuous.
Table 13. Annual water volume joining Tecate aquifer.
| Discharge | level Discharge | (L/s) Volume / Time
| (m3/d)
| (m3/mo)
| (m3/yr)
| I
| 40
| 3,456
| 103,680
| 1,261,440
| II
| 60
| 5,184
| 155,250
| 1,892,160
| III
| 100
| 8,640
| 259,200
| 3,153,600
| IV
| 150
| 12,960
| 388,800
| 4,730,400
| V
| 200
| 17,280
| 518,400
| 6,307,200
| VI
| 250
| 21,600
| 648,000
| 7,884,000
| VII
| 300
| 25,920
| 777,600
| 9,460,800
| | ||||||
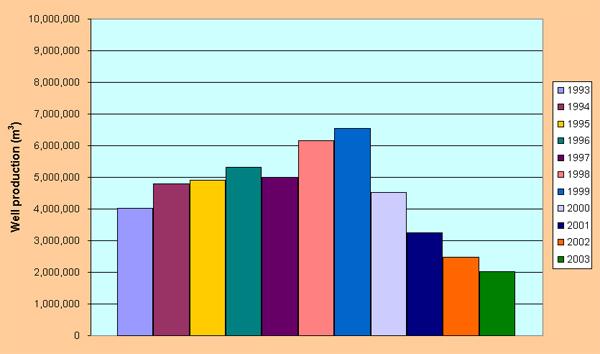
For comparison, Table 14 shows the volumes extracted by CESPTE from three well battery sites in the Tecate aquifer, and the total annual volume. It is seen that well production has declined substantially in the past three years (2001-03), indicating a possible lack of adequate groundwater recharge. The decreasing trend of the annual extraction volumes is shown in Fig. 40.
Table 14. Annual water volume
extracted by CESPTE in Tecate wells (CESPTE, 2004b).
| Year
| San Jose I | (m3) San Jose II | (m3) Pozos Rio | (m3) Total | (m3) 1993
| 1,262,677
| 1,353,165
| 1,411,361
| 4,027,203
| 1994
| 1,337,822
| 1,652,703
| 1,794,438
| 4,784,963
| 1995
| 1,561,856
| 1,693,025
| 1,664,291
| 4,919,172
| 1996
| 1,750,492
| 1,986,364
| 1,590,794
| 5,327,650
| 1997
| 1,843,668
| 1,539,844
| 1,625,049
| 5,008,561
| 1998
| 2,521,327
| 1,564,756
| 2,065,439
| 6,151,522
| 1999
| 2,875,871
| 1,746,841
| 1,914,089
| 6,536,801
| 2000
| 2,085,588
| 900,336
| 1,545,190
| 4,531,114
| 2001
| 1,600,179
| 492,866
| 1,153,769
| 3,246,814
| 2002
| 1,308,024
| 304,585
| 872,759
| 2,485,368
| 2003
| 1,144,233
| 264,576
| 617,953
| 2,026,762
| Average
|
|
|
| 4,458,994
| | ||||
|
The average annual volume of extraction for the past 11 years was 4,458,994 m
6.5 Vegetation analysis [Top]
Under conditions of very high hydraulic conductivity (in the vicinity of RP-1 and RP-6),
the delivered water will most likely percolate into the groundwater and not remain as part of the surface waters.
Under conditions of high hydraulic conductivity (in the vicinity of RP-2 and RP-4),
a portion of the delivered water will benefit surface water, vadose-zone water, and associated vegetation.
The establishment of a 2-m wide pilot channel,
as part of the river park design, will optimize the permanence of surface water and enhance the possibility of it benefiting local vegetation.
Eventually, all water delivered will percolate into the vadose zone, at which time it can follow either of two paths:
7. RESULTS [Top]
The main points of this study are summarized below:
8. CONCLUSIONS AND RECOMMENDATIONS [Top]
The conclusions of this study are summarized below:
Fig. 41 Location of RP sites along Tecate river.
The following recommendations are offered as part of this study:
9. ACKNOWLEDGMENTS [Top]
The author acknowledges the assistance of the following persons:
10. REFERENCES [Top]
Cervecería Cuauhtemoc Moctezuma (CCM). 2004. Raw data for BOD and TSS levels at PTAR CCM, furnished
by Francisco Ostos Lechuga, July.
Comisión Nacional del Agua. 1998. Estudio hidrológico de los ríos Tecate y Joe Bill. Agosto.
Comisión Estatal de Servicios Públicos de Tecate (CESPTE). 2004a. Raw data for BOD, TSS, and COD levels at PTAR,
furnished on digital format by Víctor Manuel López Álvarez, Chief of the Water Laboratory, July.
Comisión Estatal de Servicios Públicos de Tecate (CESPTE). 2004b. Raw data for well production in Tecate wells.
Delgadillo, J. 2004. Lista de árboles propuestos para el Río Parque Tecate. Personnal communication to Ana Espinoza.
Horton, R. E. 1933. The role of infiltration in the hydrologic cycle. Transactions, American Geophysical Union, Vol. 22, 350-361.
Ponce, V. M. 1989. Engineering hydrology: Principles and practices. Prentice Hall, Englewood Cliffs, New Jersey.
USDA Natural Resources Conservation Service (USDA NRSC). 1993. Channel transmission losses. Chapter 19, National Engineering Handbook, Number 4: Hydrology.
U.S. Department of Agriculture, Washington, D.C.
11. NOTATION [Top]
cm2 = square centimeters [ area ]
cm/h = centimeters per hour [ hydraulic conductivity ]
cm/s = centimeters per second [ hydraulic conductivity ]
in/h = inches per hour [ hydraulic conductivity ]
km = kilometers [ distance ]
L/s = liters per second [ discharge ]
m = meters [ length ]
m/s = meters per second [ hydraulic conductivity ]
m3 = cubic meters [ volume ]
m3/d = cubic meters per day [ daily volume ]
m3/mo = cubic meters per month [ monthly volume ]
m3/s = cubic meters per second [ discharge ]
m3/yr = cubic meters per year [ annual volume ]
mg/L = milligrams per liter [ constituent concentration ]
mm = millimeters [ length ]
yr = year [ time ]
Table 15. Annual water volume
joining Tecate aquifer, relative to extraction from wells.
Discharge
level
Discharge
(L/s)
Volume
(mRelative volume
(% of 1993-2003 average)
Relative volume
(% of 2003 value)
I
40
1,261,440
28.2
62.2
II
60
1,892,160
42.4
93.3
III
100
3,153,600
70.7
155.6
IV
150
4,730,400
106.1
233.3
V
200
6,307,200
141.4
311.1
VI
250
7,884,000
176.8
389.0
VII
300
9,460,800
212.1
466.8
In either case, the delivered water will provide the follwing benefits:

041004