[Introduction]
[Background]
[Methodology]
[Data Collection]
[Results]
[Conclusions]
[References]
•
|
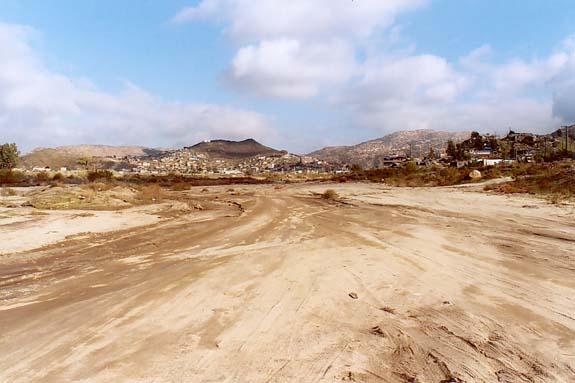
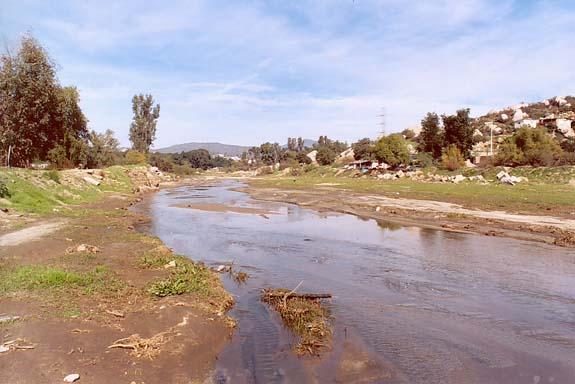
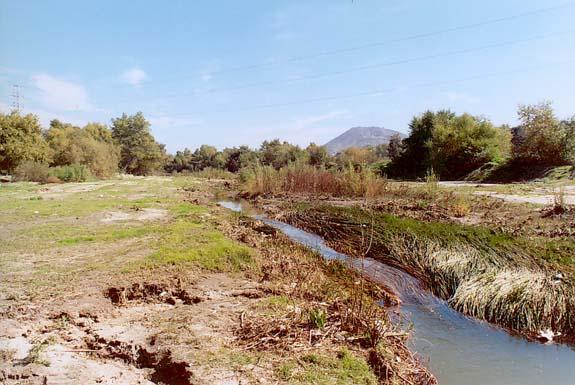
Fig. 1. Tecate Creek, downstream of Tecate, Baja California.
|
|
FLOOD HYDRAULICS OF TECATE CREEK,
TECATE, BAJA CALIFORNIA, MEXICO
|
|
NARRATIVE SUMMARY
|
A hydraulic study has been performed with the objective of ascertaining flood stages
for a 11.56-km reach of Tecate Creek, at Tecate, Baja California, Mexico. The study underpins ongoing studies to restore Tecate Creek
to productive stability. The aim is to assure adequate flood conveyance for regulatory and design peak discharges,
while preserving and enhancing related hydroecological, socioeconomic, and aesthetic functions.
The hydrological model HEC-RAS has been used for this study.
The peak discharges were developed in a companion study (Ponce et al., 2005).
Two flood frequencies are considered: (1) a regulatory 10-yr flood,
and (2) a design 500-yr flood. It is found that the 10-yr flood overflows the current low-flow channel in many of the existing cross sections.
Moreover, the 500-yr flood overflows the current high-flow channel in most of the existing cross sections.
Given the results of the hydraulic model, it is clear that an expanded flood control channel is needed for Tecate Creek.
A prismatic 25-m width and 2.5-m depth low-flow channel is able to convey the regulatory 10-yr flood.
A 30-m width and 3.5-m depth high-flow flood plain is able to convey the design 500-yr flood with an adequate freeboard.
This channel is also able to convey the maximum 10,000-yr flood by using the available freeboard.
The proposed flood-plain channel underpins a long-term plan to provide much needed recreational space to enhance the quality of life of
the local population.
|
|
1. INTRODUCTION
[Background]
[Methodology]
[Data Collection]
[Results]
[Conclusions]
[References]
•
[Top]
[Introduction]
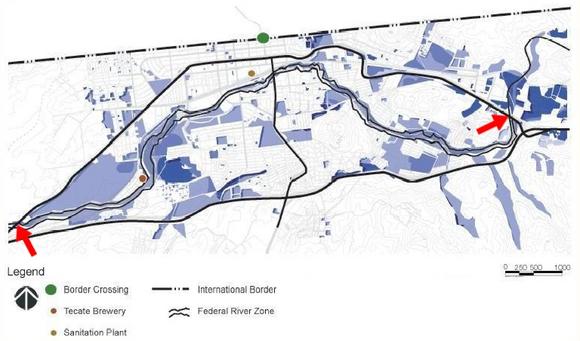
Tecate Creek, in Tecate, Baja California, Mexico (Fig. 1), is being considered by local, state, and federal agencies for rehabilitation. The project
encompasses 11.56 km of Tecate Creek, from the upstream end at Puente San Jose II, east of Tecate proper, to the downstream end at
Puente La Puerta, west of Tecate (Fig. 2). It is expected that the project will be executed in phases over the next twenty years,
as resources become available.
The rehabilitation project seeks to provide a host of natural and anthropogenic functions to restore Tecate Creek to
productive stability. Several functions will be enhanced by the rehabilitation project.
These are: (1) flood conveyance, (2) groundwater replenishment,
(3) compliance with federal stream-zoning regulations, (4) preservation of the riparian corridor, (5) enhancement of water quality,
and (6) establishment of open areas for parks, sports and recreation, including landscaping and aesthetics.
The project is of strategic binational importance, since Tecate Creek forms part of the Tijuana river basin,
which straddles the U.S.-Mexican border along the states of California and Baja California.
The hydrologic system constituted by Campo-Tecate Creek
has its headwaters near Live Oak Springs, in Eastern San Diego County, California, and flows past the town of Campo into Mexico.
There it changes name, first to Cañada
Joe Bill, and then to Arroyo Tecate (Tecate Creek). Thus, the hydrologic fate of Tecate Creek and its contributing
watershed is intertwined with that of Campo Creek, on the U.S. side
of the border.
A companion study has determined flood discharges for return periods ranging from 2 years to 10,000 years
(Ponce et al., 2005). The present study determines the hydraulics of the existing stream channel under a wide range of
postulated flood discharges. Thus, this report focuses on the calculation of the water-surface profiles using the Hydrologic Engineering Center's
River Analysis System
(HEC-RAS) (U.S. Army Corps of Engineers, 2002). The use of this model is necessary to assess the existing stream channel's hydraulic competence to
carry the regulatory and design floods. The 11.56-km study reach is currently in various stages of development. This includes:
(a) reaches that have been disturbed but are as yet undeveloped,
(b) reaches that are currently being planned for development, and
(c) reaches where existing planned and/or unplanned development has encroached upon the stream's ability to convey the floods.
On the basis of this analysis, several design choices would have to be made by the competent authorities, both federal and local, to
guarantee a measure of flood protection to the population of Tecate.
|
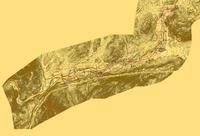
Fig. 2. Tecate Creek project limits: Puente San Jose II (east),
and Puente La Puerta (west) (Source: Huffman & Carpenter, Inc.).
|
|
|
2. BACKGROUND
[Methodology]
[Data Collection]
[Results]
[Conclusions]
[References]
•
[Top]
[Introduction]
[Background]
The Comisión Nacional del Agua (CNA) [National Water Commission of Mexico],
the Secretaría de Infraestructura y Desarrollo Urbano (SIDUE) [Department of Intrastructure and Urban Development of Baja California],
and the Ayuntamiento de Tecate [Municipality of Tecate] are the federal, state, and local
government agencies, respectively, with jurisdiction over Tecate Creek.
Previous studies have been performed by Rhoda Arkhos Ingeniería S.C. (Rhoda Arkhos, undated), the
California State Polytechnic University Studio 606 (2003), and the Centro de Estudios Sociales y Sustentables (2004).
Other studies have been completed by Huffman & Carpenter, Inc. and the Institute of Regional Studies of the Californias (SDSU).
A comprehensive model-based flood hydrology study has been completed for Tecate Creek (Ponce et al., 2005).
The specific tool is event rainfall-runoff modeling featuring distributed catchment parameterization.
This includes distributed formulations of the following hydrologic processes:
(a) precipitation, (b) hydrologic abstraction, (c) rainfall-runoff transform, (d) channel routing, and (e) channel transmission losses.
Based on the availability of depth-duration-frequency precipitation data,
the catchment modeling (rainfall-runoff) was performed for 2-yr, 5-yr, 10-yr, 25-yr, 50-yr, and 100-yr return periods.
Once these values were established, extensions up to the 10,000-yr return period
were developed using the Gumbel extreme-value probability distribution (Ponce, 1989).
In Mexico and other countries, the 10,000-yr return period is used as a surrogate to the Probable Maximum Precipitation (PMP).
Table 1 shows
the complete series of flood peak discharges
for Tecate Creek.
|
Table 1. Flood peak discharges for Tecate Creek. |
Return period
(yr)
| Flood peak discharge
(m3s-1)
|
| 2
| 87
|
| 5
| 190
|
| 10
| 268
|
| 25
| 396
|
| 50
| 675
|
| 100
| 770
|
| 200
| 843
|
| 500
| 997
|
| 1000
| 1,113
|
| 2,000
| 1,230
|
| 5,000
| 1,383
|
| 10,000
| 1,499
|
|
|
3. METHODOLOGY
[Data Collection]
[Results]
[Conclusions]
[References]
•
[Top]
[Introduction]
[Background]
[Methodology]
The HEC-RAS model calculates water-surface profiles when presented with the appropriate hydraulic and geometric data.
The following data is required to run the model:
(1) a set of digitized cross sections,
(2) the friction coefficients for inbank and overbank flows,
(3) the limits of inbank and overbank flows,
(4) the lengths of inbank and overbank flows,
(5) the design discharge, and
(6) a suitable downstream boundary condition.
The cross sections are chosen to approximately represent the spatial variability of the stream channel.
The limits of inbank and overbank flows are determined based on the field and laboratory examination of the cross-sectional geometry (Fig. 3).
The friction coefficients are estimated based on previous experience and established practice (Chow, 1959; Barnes, 1967).
The design discharge is that corresponding to the chosen return period (Table 1).
The downstream boundary condition is usually taken as a calculated normal stage/depth based on a specified channel slope.
|
Fig. 3. Upstream view of Tecate Creek at El Descanso.
|
|
|
4. DATA COLLECTION
[Results]
[Conclusions]
[References]
•
[Top]
[Introduction]
[Background]
[Methodology]
[Data Collection]
The total length of the modeled reach of Tecate Creek is 11,560 m.
To preserve accuracy, the distance between cross sections was chosen as 200 m.
Accordingly, a total of 59 cross sections were obtained, based on the available topographic imagery.
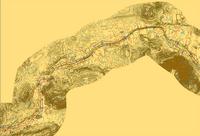
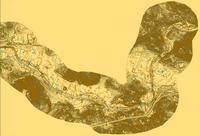
The topography and channel alignment are shown in Fig. 4. For display purposes, in this figure the total channel length is divided into three reaches:
(a) downstream, (b) middle, and (c) upstream.
|
a. Downstream third
|
|
b. Middle third
|
|
c. Upstream third
|
|
|
Fig. 4. Detail of the topography and horizontal alignment.
|
Table 2 shows the hydraulic and geometric characteristics of Tecate Creek.
Column 1 shows sequential numbers for the cross sections.
Column 2 shows the cumulative distance, measured from upstream to downstream, as needed for surveying purposes.
Column 3 shows the relabeled station distances, from downstream to upstream, as needed for HEC-RAS modeling.
Columns 4-6 show left overbank, center channel, and right overbank Manning friction coefficients, respectively.
Columns 7 and 8 show left and right overbank station limits, respectively.
Columns 9-11 show left overbank, center channel, and right overbank channel lengths, respectively.
|
Table 2. Cross-section hydraulic and geometric characteristics
for HEC-RAS model.1 |
| No.
| Distance
from u/s
(m)
| HEC-RAS
station
(m)
| L. O. n
| C. Ch. n
| R. O. n
| L. O. limit
(m)
| R. O. limit
(m)
| L. O. length
(m)
| Channel
length
(m)
| R. O. length
(m)
|
| (1)
| (2)
| (3)
| (4)
| (5)
| (6)
| (7)
| (8)
| (9)
| (10)
| (11)
|
| 1
| 0+000
| 11+560
| 0.055
| 0.030
| 0.055
| 2.607
| 28.0871
| 188.137
| 200.000
| 211.863
|
| 2
| 0+200
| 11+360
| 0.065
| 0.035
| 0.050
| 53.764
| 124.326
| 217.602
| 200.000
| 182.398
|
| 3
| 0+400
| 11+160
| 0.050
| 0.030
| 0.070
| 19.022
| 67.456
| 266.274
| 200.000
| 133.726
|
| 4
| 0+600
| 10+960
| 0.070
| 0.035
| 0.060
| 166.924
| 226.002
| 176.349
| 200.000
| 221.998
|
| 5
| 0+800
| 10+760
| 0.070
| 0.035
| 0.050
| 87.55
| 115.806
| 200.000
| 200.000
| 200.000
|
| 6
| 1+000
| 10+560
| 0.070
| 0.035
| 0.050
| 5.94
| 78.873
| 219.815
| 200.000
| 179.794
|
| 7
| 1+200
| 10+360
| 0.050
| 0.030
| 0.060
| 43.767
| 106.121
| 196.989
| 200.000
| 203.009
|
| 8
| 1+400
| 10+160
| 0.070
| 0.040
| 0.060
| 44.552
| 119.128
| 230.232
| 200.000
| 169.768
|
| 9
| 1+600
| 9+960
| 0.050
| 0.035
| 0.060
| 50.905
| 194.257
| 214.160
| 200.000
| 185.840
|
| 10
| 1+800
| 9+760
| 0.050
| 0.035
| 0.070
| 7.561
| 99.223
| 173.018
| 200.000
| 226.982
|
| 11
| 2+000
| 9+560
| 0.050
| 0.030
| 0.060
| 12.510
| 181.616
| 200.000
| 200.000
| 200.000
|
| 12
| 2+200
| 9+360
| 0.050
| 0.030
| 0.060
| 110.179
| 301.564
| 184.419
| 200.000
| 215.581
|
| 13
| 2+400
| 9+160
| 0.060
| 0.035
| 0.070
| 253.533
| 382.722
| 216.138
| 200.000
| 183.862
|
| 14
| 2+600
| 8+960
| 0.050
| 0.035
| 0.050
| 157.525
| 219.931
| 211.267
| 200.000
| 188.733
|
| 15
| 2+800
| 8+760
| 0.070
| 0.035
| 0.060
| 198.68
| 300.81
| 202.953
| 200.000
| 197.047
|
| 16
| 3+000
| 8+560
| 0.070
| 0.050
| 0.070
| 45.447
| 127.35
| 200.000
| 200.000
| 200.000
|
| 17
| 3+200
| 8+360
| 0.050
| 0.030
| 0.070
| 30.325
| 166.778
| 219.561
| 200.000
| 180.066
|
| 18
| 3+400
| 8+160
| 0.050
| 0.030
| 0.070
| 9.461
| 86.307
| 200.000
| 200.000
| 200.000
|
| 19
| 3+600
| 7+960
| 0.050
| 0.030
| 0.050
| 79.077
| 134.986
| 171.760
| 200.000
| 230.516
|
| 20
| 3+800
| 7+760
| 0.050
| 0.035
| 0.050
| 95.231
| 192.080
| 214.988
| 200.000
| 185.012
|
| 21
| 4+000
| 7+560
| 0.050
| 0.030
| 0.050
| 71.057
| 144.537
| 200.000
| 200.000
| 200.000
|
| 22
| 4+200
| 7+360
| 0.050
| 0.030
| 0.050
| 109.224
| 180.096
| 230.531
| 200.000
| 169.470
|
| 23
| 4+400
| 7+160
| 0.070
| 0.035
| 0.060
| 162.003
| 189.080
| 175.330
| 200.000
| 224.670
|
| 24
| 4+600
| 6+960
| 0.050
| 0.030
| 0.050
| 361.058
| 386.521
| 163.821
| 200.000
| 236.180
|
| 25
| 4+800
| 6+760
| 0.055
| 0.035
| 0.055
| 116.874
| 142.036
| 193.663
| 200.000
| 206.337
|
| 26
| 5+000
| 6+560
| 0.070
| 0.040
| 0.060
| 193.097
| 217.756
| 197.175
| 200.000
| 202.825
|
| 27
| 5+200
| 6+360
| 0.050
| 0.045
| 0.050
| 300.665
| 336.592
| 172.943
| 200.000
| 227.057
|
| 28
| 5+400
| 6+160
| 0.065
| 0.050
| 0.060
| 259.310
| 281.740
| 206.455
| 200.000
| 193.545
|
| 29
| 5+600
| 5+960
| 0.060
| 0.045
| 0.06
| 214.170
| 237.200
| 206.927
| 200.000
| 193.073
|
| 30
| 5+800
| 5+760
| 0.060
| 0.040
| 0.060
| 162.210
| 193.060
| 228.103
| 200.000
| 171.897
|
| 31
| 6+000
| 5+560
| 0.050
| 0.030
| 0.060
| 79.800
| 108.100
| 181.311
| 200.000
| 218.689
|
| 32
| 6+200
| 5+360
| 0.050
| 0.035
| 0.065
| 321.260
| 347.500
| 175.000
| 200.000
| 225.000
|
| 33
| 6+400
| 5+160
| 0.075
| 0.050
| 0.075
| 319.050
| 346.000
| 193.432
| 200.000
| 206.568
|
| 34
| 6+600
| 4+960
| 0.090
| 0.070
| 0.090
| 334.500
| 354.400
| 225.792
| 200.000
| 174.208
|
| 35
| 6+800
| 4+760
| 0.090
| 0.070
| 0.080
| 214.100
| 242.400
| 200.000
| 200.000
| 200.000
|
| 36
| 7+000
| 4+560
| 0.050
| 0.050
| 0.070
| 110.700
| 154.200
| 239.257
| 200.000
| 165.657
|
| 37
| 7+200
| 4+360
| 0.070
| 0.050
| 0.070
| 40.107
| 97.658
| 165.676
| 200.000
| 234.335
|
| 38
| 7+400
| 4+160
| 0.050
| 0.035
| 0.050
| 91.900
| 112.141
| 171.208
| 200.000
| 228.792
|
| 39
| 7+600
| 3+960
| 0.070
| 0.055
| 0.065
| 141.600
| 200.500
| 159.216
| 200.000
| 240.784
|
| 40
| 7+800
| 3+760
| 0.070
| 0.040
| 0.070
| 162.500
| 211.600
| 275.354
| 200.000
| 134.774
|
| 41
| 8+000
| 3+560
| 0.070
| 0.050
| 0.070
| 146.500
| 201.300
| 111.113
| 200.000
| 288.887
|
| 42
| 8+200
| 3+360
| 0.070
| 0.035
| 0.070
| 161.700
| 225.000
| 218.780
| 200.000
| 181.703
|
| 43
| 8+400
| 3+160
| 0.070
| 0.035
| 0.070
| 30.800
| 111.300
| 200.000
| 200.000
| 200.000
|
| 44
| 8+600
| 2+960
| 0.090
| 0.070
| 0.090
| 93.900
| 194.600
| 200.000
| 200.000
| 200.000
|
| 45
| 8+800
| 2+760
| 0.080
| 0.040
| 0.070
| 73.200
| 261.600
| 256.107
| 200.000
| 143.893
|
| 46
| 9+000
| 2+560
| 0.070
| 0.040
| 0.070
| 56.404
| 143.345
| 164.710
| 200.000
| 235.290
|
| 47
| 9+200
| 2+360
| 0.070
| 0.035
| 0.060
| 220.400
| 301.800
| 236.660
| 200.000
| 163.340
|
| 48
| 9+400
| 2+160
| 0.070
| 0.040
| 0.070
| 39.300
| 85.600
| 202.127
| 200.000
| 197.872
|
| 49
| 9+600
| 1+960
| 0.070
| 0.035
| 0.080
| 50.500
| 169.500
| 225.485
| 200.000
| 174.515
|
| 50
| 9+800
| 1+760
| 0.070
| 0.040
| 0.080
| 85.700
| 170.100
| 209.202
| 200.000
| 190.614
|
| 51
| 10+000
| 1+560
| 0.090
| 0.050
| 0.090
| 161.900
| 199.629
| 169.232
| 200.000
| 230.768
|
| 52
| 10+200
| 1+360
| 0.070
| 0.035
| 0.070
| 133.776
| 168.146
| 185.556
| 200.000
| 214.444
|
| 53
| 10+400
| 1+160
| 0.070
| 0.035
| 0.070
| 93.933
| 160.866
| 219.768
| 200.000
| 180.232
|
| 54
| 10+600
| 0+960
| 0.060
| 0.035
| 0.060
| 4.731
| 142.056
| 229.139
| 200.000
| 170.861
|
| 55
| 10+800
| 0+760
| 0.060
| 0.035
| 0.060
| 79.252
| 187.027
| 168.413
| 200.000
| 229.121
|
| 56
| 11+000
| 0+560
| 0.060
| 0.035
| 0.060
| 96.192
| 175.461
| 171.274
| 200.000
| 228.726
|
| 57
| 11+200
| 0+360
| 0.060
| 0.035
| 0.060
| 26.364
| 142.680
| 257.403
| 200.000
| 142.597
|
| 58
| 11+400
| 0+160
| 0.060
| 0.035
| 0.060
| 28.674
| 172.544
| 132.376
| 160.000
| 188.749
|
| 59
| 11+560
| 0+000
| 0.060
| 0.035
| 0.060
| 58.666
| 132.860
| 0.000
| 0.000
| 0.000
|
| 1
L. O. = left overbank; n = Manning n; C. Ch. = center channel, R. O. = right overbank.
|
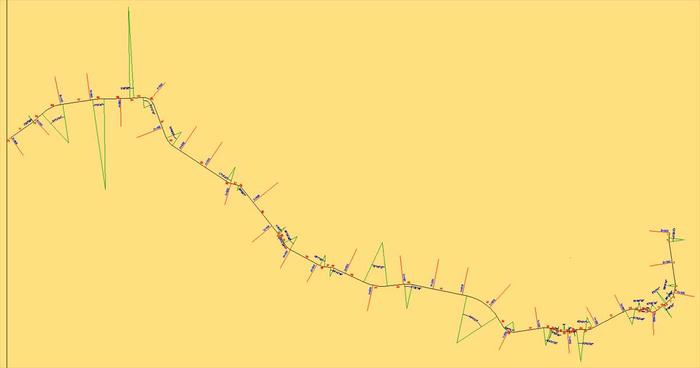
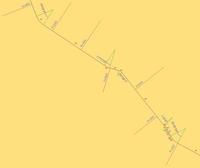
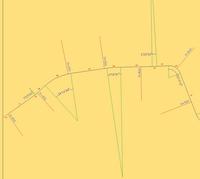
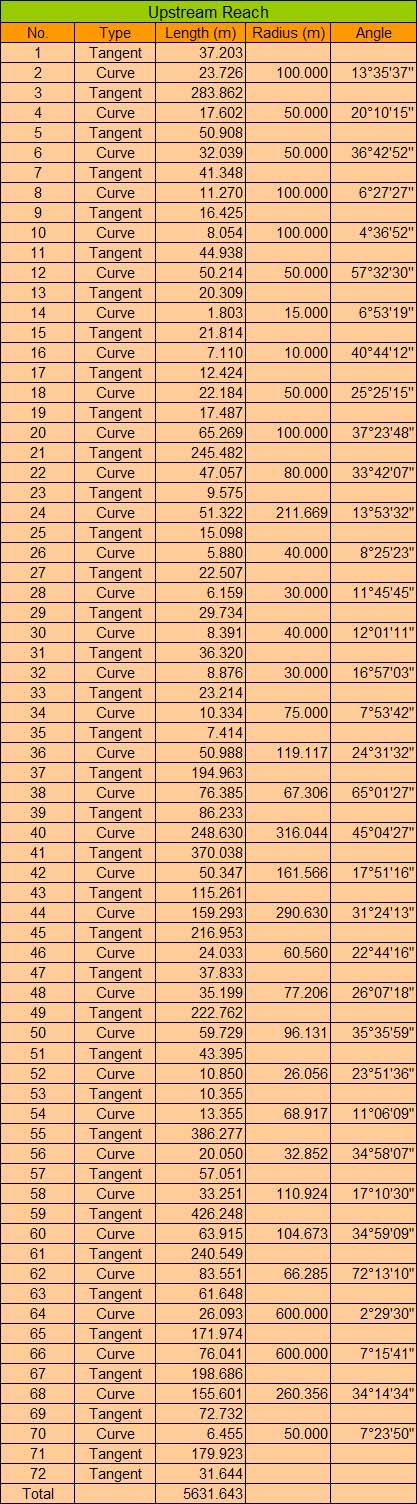
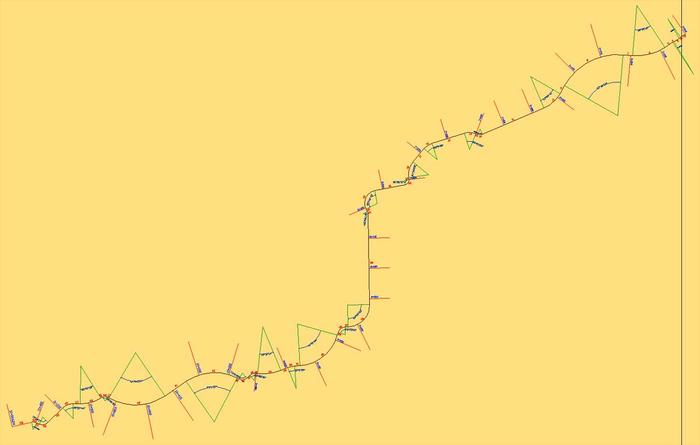
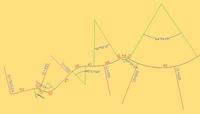
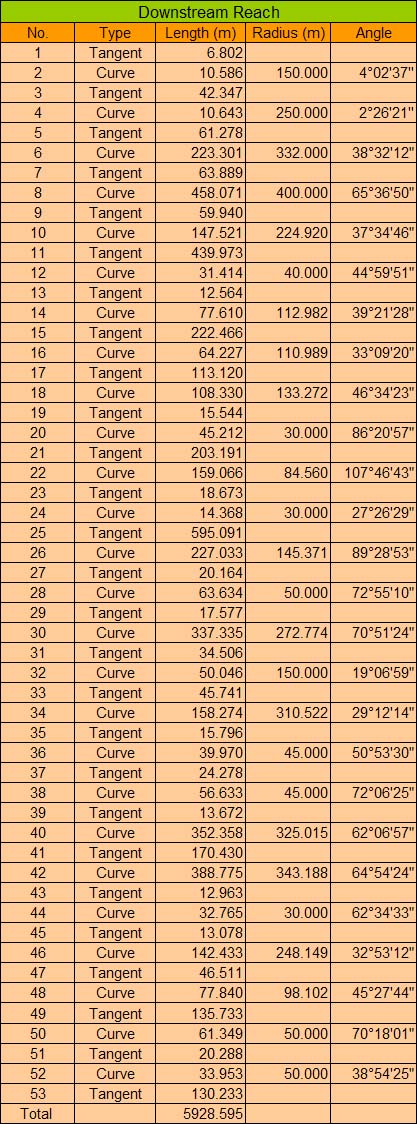
Figure 5 shows the horizontal alignment of the upstream half reach. Figure 6 shows details of the horizontal alignment for this reach. Figure 7 shows the
geometric data for the horizontal alignment for this reach.
|
Fig. 5. Horizontal alignment of the upstream half reach.
|
|
Fig. 6. Detail of the horizontal alignment of the upstream half reach.
|
|
Fig. 7. Geometric data for the horizontal alignment of the upstream half reach.
|
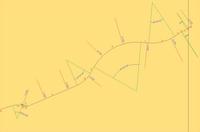
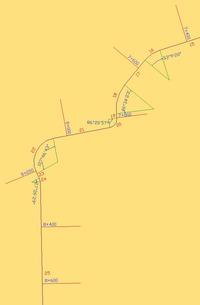
Figure 8 shows the horizontal alignment of the downstream half reach. Figure 9 shows details of the horizontal alignment for this reach. Figure 10 shows the
geometric data for the horizontal alignment for this reach.
|
Fig. 8. Horizontal alignment of the downstream half reach.
|
|
Fig. 9. Detail of the horizontal alignment of the downstream half reach.
|
|
Fig. 10. Geometric data for the horizontal alignment of the downstream half reach.
|
|
Three levels of flood discharge are adopted for HEC-RAS modeling. The first level is used in
Mexican practice to establish the limits of the regulatory or federal zone (the "Zona Federal"). This level is commonly taken as the 10-yr flood.
The second level is used for flood control projects in mid-size cities such as Tecate. This level is established by CNA practice
as the 500-yr flood.
The third level is the frequency-based flood equivalent to the Probable Maximum Flood.
This is the 10,000-yr flood, used to size the freeboard (Natural Resources Conservation Service, 1960; Ponce, 1989).
Table 3 shows the design discharges adopted for this study: (1) regulatory, with 10-yr return period;
(2) design, with 500-yr return period; and (3) probable maximum, with 10,000-yr return period.
Lastly, the downstream boundary condition was specified as a channel slope.
This value was determined to be So = 0.00692.
|
Table 3. Design flood peak discharges for Tecate Creek. |
| Level
| Level of
protection
| Return period
(yr)
| Flood peak discharge
(m3s-1)
|
| 1
| Regulatory
| 10
| 268
|
| 2
| Design
| 500
| 997
|
| 3
| Maximum
| 10,000
| 1,499
|
|
|
5. RESULTS
[Conclusions]
[References]
•
[Top]
[Introduction]
[Background]
[Methodology]
[Data Collection]
[Results]
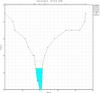
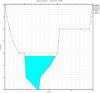
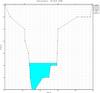
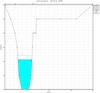
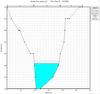
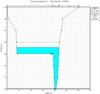
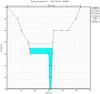
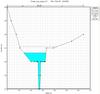
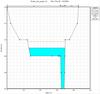
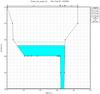
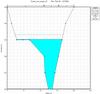
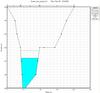
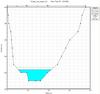
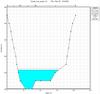
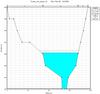
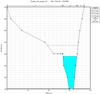
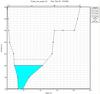
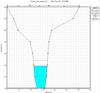
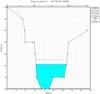
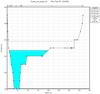
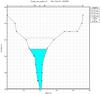
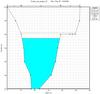
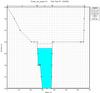
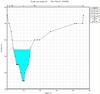
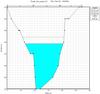
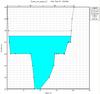
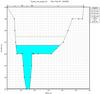
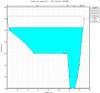
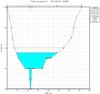
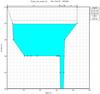
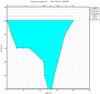
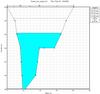
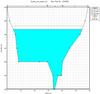
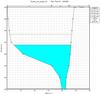
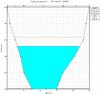
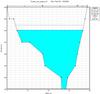
The results of the HEC-RAS simulation using the existing cross sections are shown in Figs. 11 to 20.
Figures 11 to 15 show the results for the 10-yr frequency, and Figs. 16 to 20 show the results for the 500-yr frequency.
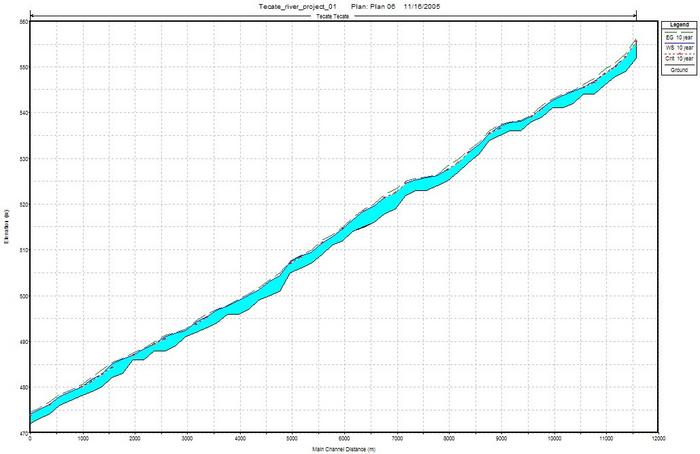
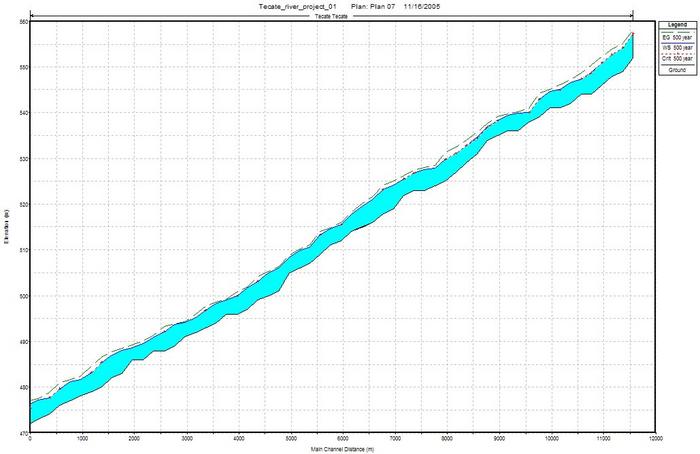
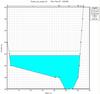
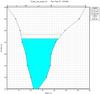
Figure 11 shows the water-surface profile
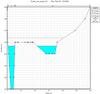
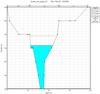
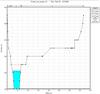
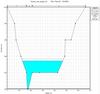
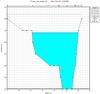
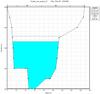
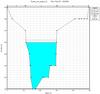
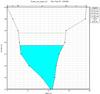
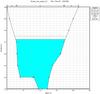
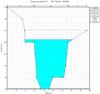
for the peak discharge corresponding to the 10-yr frequency. Figure 12 shows the 59 calculated cross sections, from 11+560 to 0+000, every 200 m.
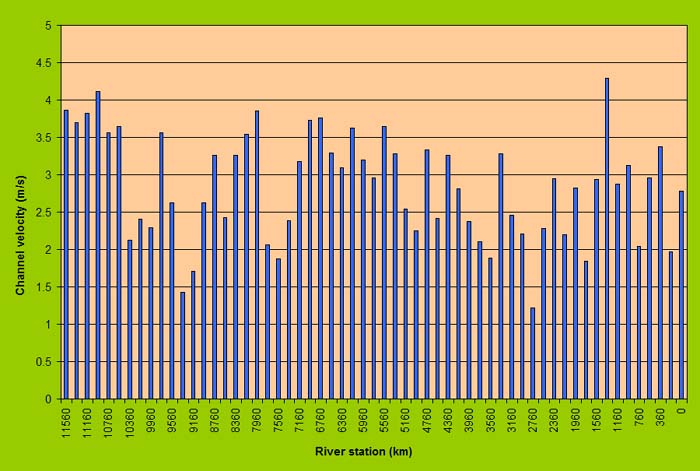
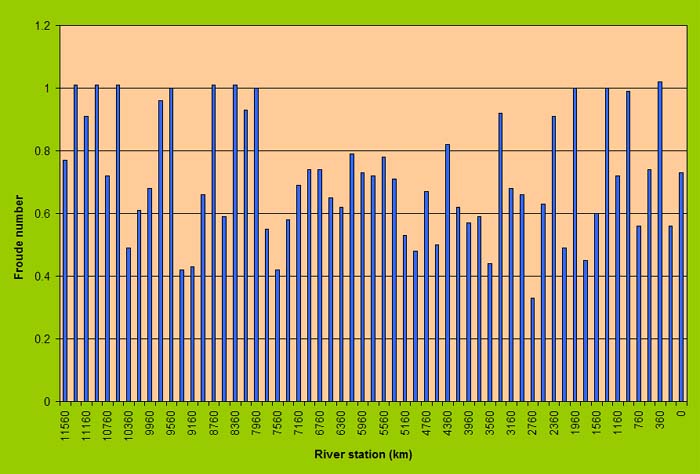
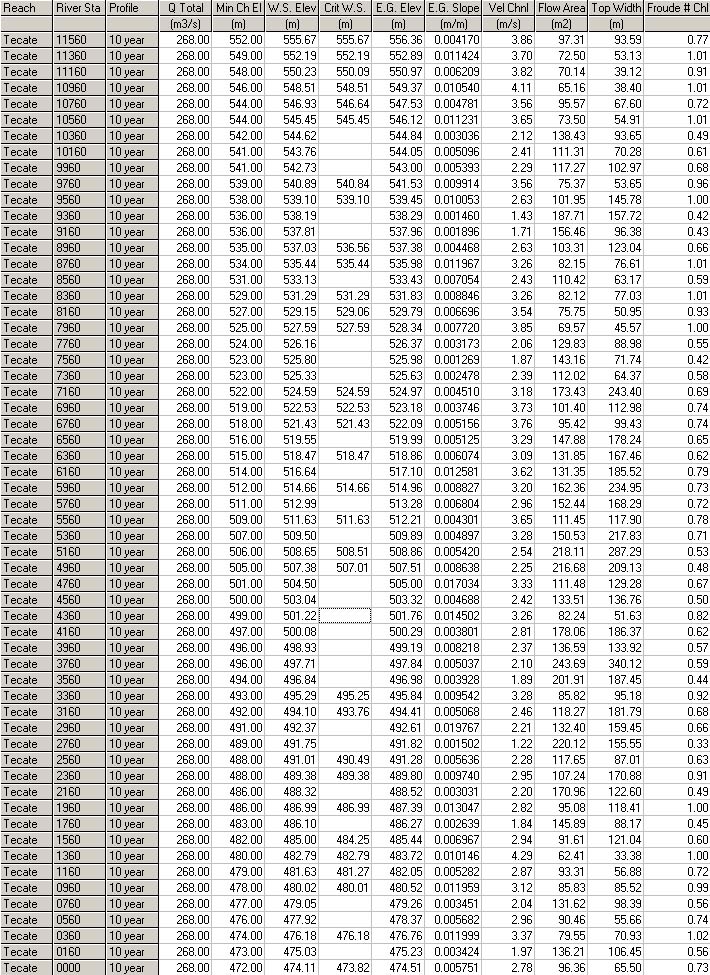
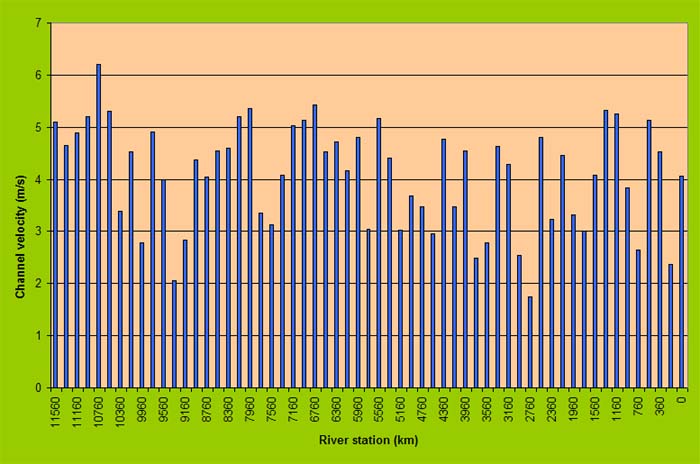
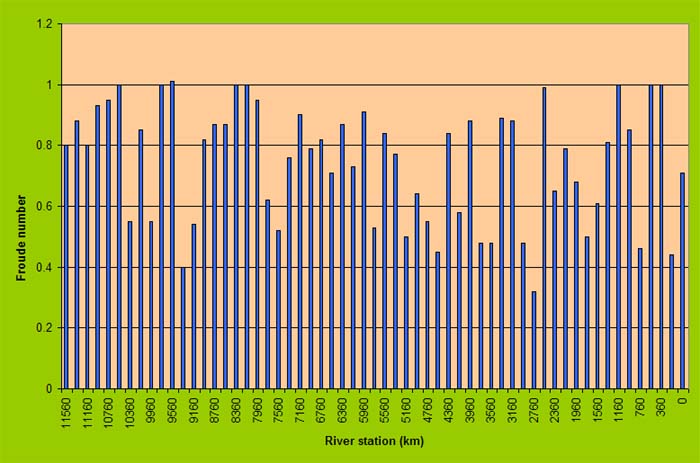
Figures 13 and 14 show the calculated channel velocities and Froude numbers, respectively. Figure 15 shows the HEC-RAS summary table,
including the water-surface elevations for all the cross sections.
|
|
|
Fig. 11. HEC-RAS water-surface profile, 10-yr frequency (click to enlarge).
|
|
Fig. 12. Calculated cross sections for Tecate Creek, 10-yr frequency.
|
|
Fig. 13. HEC-RAS channel velocities, 10-yr frequency.
|
|
Fig. 14. HEC-RAS Froude numbers, 10-yr frequency.
|
|
Fig. 15. HEC-RAS summary table, 10-yr frequency.
|
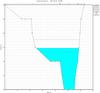
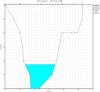
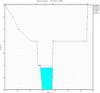
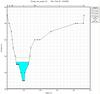
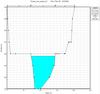
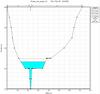
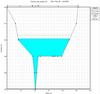
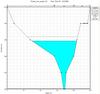
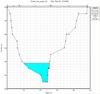
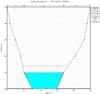
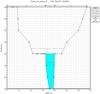
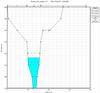
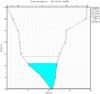
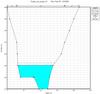
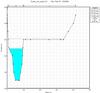
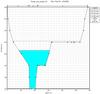
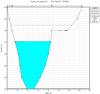
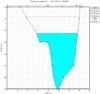
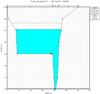
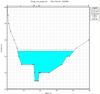
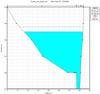
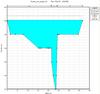
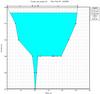
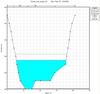
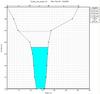
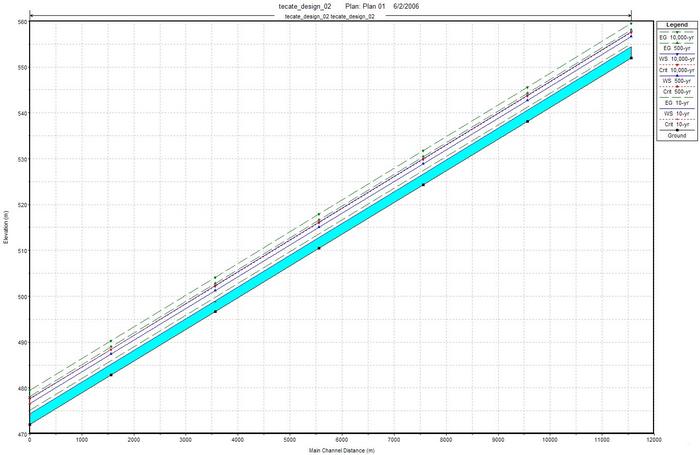
Figure 16 shows the water-surface profile
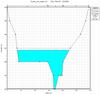
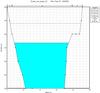
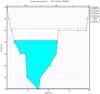
for the peak discharge corresponding to the 500-yr frequency. Figure 17 shows the 59 calculated cross sections, from 11+560 to 0+000, every 200 m.
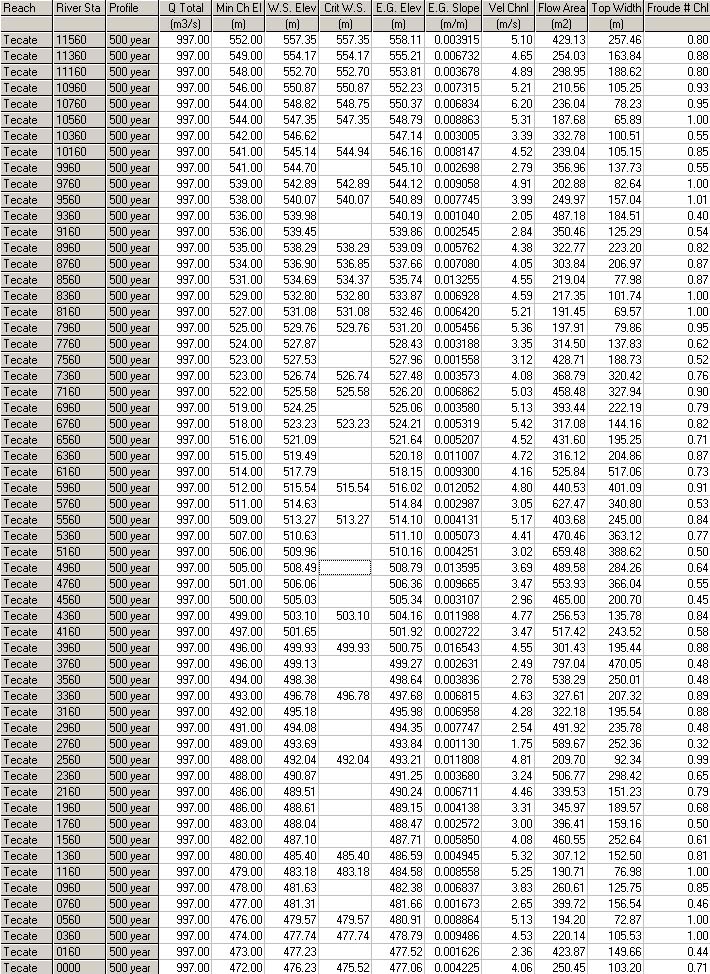
Figures 18 and 19 show the calculated channel velocities and Froude numbers, respectively. Figure 20 shows the HEC-RAS summary table,
including the water-surface elevations for all the cross sections.
|
Fig. 16. HEC-RAS water-surface profile, 500-yr frequency (click to enlarge).
|
|
|
|
Fig. 17. Calculated cross sections for Tecate Creek, 500-yr frequency.
|
|
Fig. 18. HEC-RAS channel velocities, 500-yr frequency.
|
|
Fig. 19. HEC-RAS Froude numbers, 500-yr frequency.
|
|
Fig. 20. HEC-RAS summary table, 500-yr frequency.
|
|
|
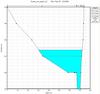
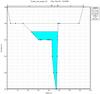
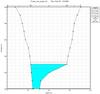
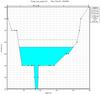
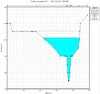
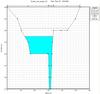
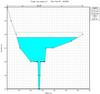
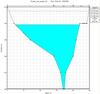
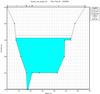
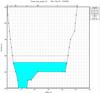
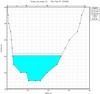
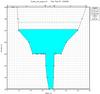
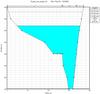
A second series of HEC-RAS runs was accomplished by designing a
prismatic six-point flood channel, to convey the 10-yr flood inbank and the 500-yr flood
out-of-bank, including an engineered flood plain.
The design cross section was dimensioned to convey the 500-yr flood with a suitable freeboard.
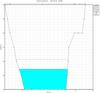
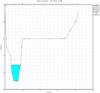
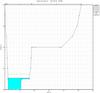
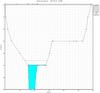
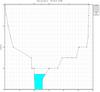
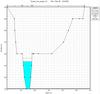
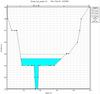
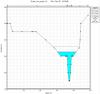
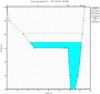
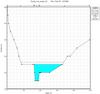
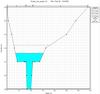
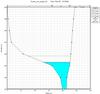
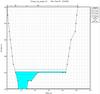
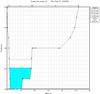
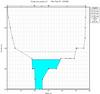
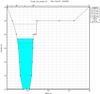
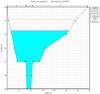
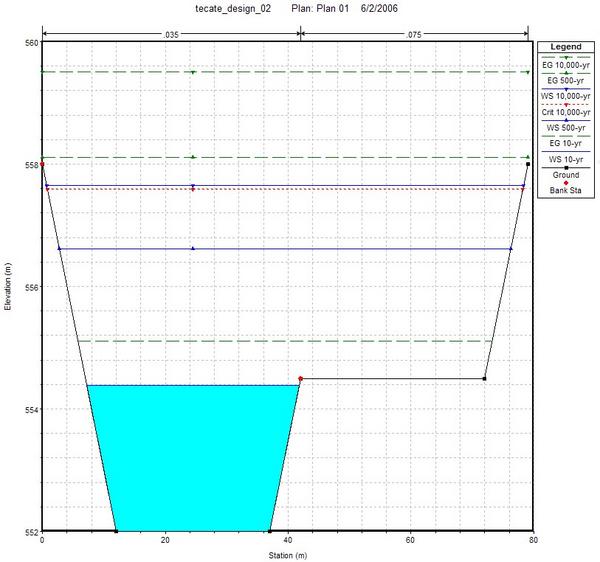
Accordingly, the inbank channel was set at 25-m width and 2.5-m depth, with side slopes 2:1 (H:V). The flood plain (out-of-bank channel)
was set at 30-m width and 3.5-m depth, with side slopes 2:1 (H:V).
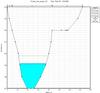
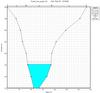
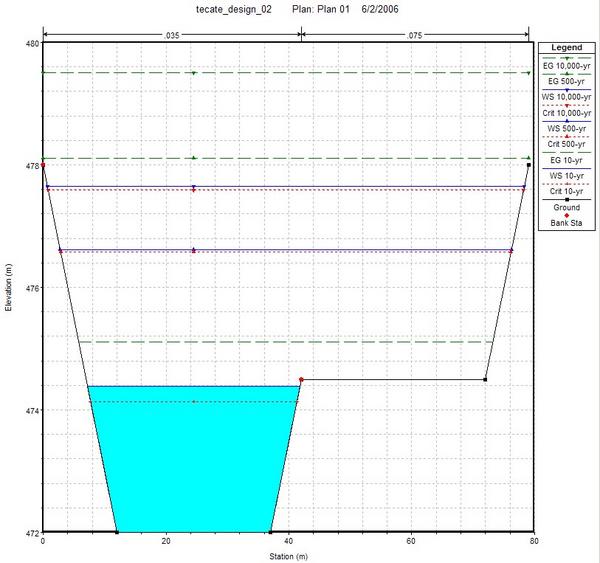
Figure 21 shows the water-surface profile
for the peak discharge corresponding to the 10-yr, 500-yr, and 10,000-yr frequencies.
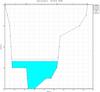
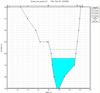
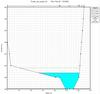
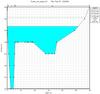
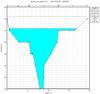
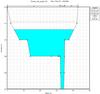
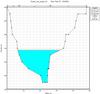
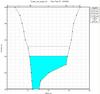
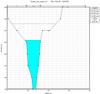
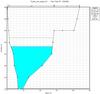
Figures 22 and 23 shows two typical cross sections: (1) upstream, at 11+560 m, and (2) downstream, at 0+000 m.
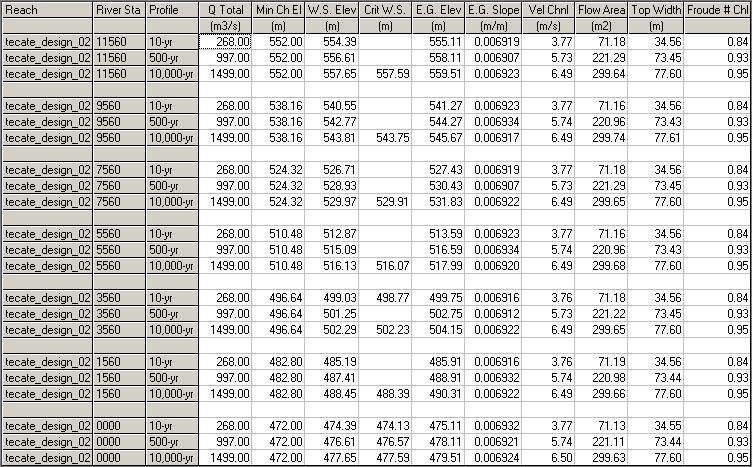
Figure 24 shows the HEC-RAS summary table,
including the water-surface elevations for all seven (7) cross sections.
From Fig. 24, it is seen that
the freeboard in the inbank channel (10-yr frequency) is: 474.50 - 474.39 = 0.11 m.
Likewise, the freeboard for the flood-plain channel for the 500-yr frequency is: 478.00- 476.61 = 1.39 m.
Also, the freeboard for the flood-plain channel for the probable maximum flood (10,000-yr) is: 478.00- 477.65 = 0.35 m.
Channel velocities are 3.77, 5.74, and 6.50 m/s for the 10-yr, 500-yr, and 10,000-yr floods, respectively.
Froude numbers are 0.84, 0.93, and 0.95, respectively.
The results are summarized in Table 4.
|
Fig. 21. HEC-RAS water-surface profile, design cross section (click to enlarge).
|
|
Fig. 22. HEC-RAS design cross section at 11+560 (click to enlarge).
|
|
Fig. 23. HEC-RAS design cross section at 0+000 (click to enlarge).
|
|
Fig. 24. HEC-RAS design cross section summary table.
|
|
|
Table 4. Hydraulic characteristics of flood-conveyance channel for Tecate Creek. |
| Level
| Level of
protection
| Return period
(yr)
| Flood peak discharge
(m3s-1)
| Channel depth
(m)
| Channel velocity
(m/s)
| Froude number
| Freeboard
(m)
|
| 1
| Regulatory
| 10
| 268
| 2.39
| 3.77
| 0.84
| 0.11 1
|
| 2
| Design
| 500
| 997
| 4.61
| 5.74
| 0.93
| 1.39 2
|
| 3
| Maximum
| 10,000
| 1,499
| 5.65
| 6.50
| 0.95
| 0.35 2
|
1
inbank channel.
2
flood-plain channel.
|
|
6. CONCLUSIONS
[References]
•
[Top]
[Introduction]
[Background]
[Methodology]
[Data Collection]
[Results]
[Conclusions]
A hydraulic asessment has been made of the ability of the present Tecate Creek to convey regulatory (10-yr)
and design (500-yr) flood discharges.
It is shown that the current flood channel is limited in some cross sections in its ability to convey the 10-yr and 500-yr floods.
An expanded cross section is suggested, together with a vision for a flood-plain channel that can readily double as recreational space.
The following conclusions are derived from this study:
- The 10-yr flood (268 m3/sec) overflows the current low-flow channel in many of the existing cross sections (see cross sections of Fig. 12).
- The 500-yr flood (997 m3/sec) overflows the current high-flow channel in most of the existing cross sections (see cross sections of Fig. 17).
- A 25-m width, 2.5-m depth, and size slopes 2H:1V low-flow channel is able to convey the regulatory 10-yr flood.
- A 30-m width, 3.5-m depth, and size slopes 2H:1V high-flow flood plain is able, when taken together with the low-flow channel, to convey the design
500-yr flood with an adequate freeboard (1.39 m).
- A 30-m width, 3.5-m depth, and size slopes 2H:1V high-flow flood-plain channel is able to convey the maximum 10,000-yr
flood by using most of the available freeboard.
- Right-of-way and related studies are required to guarantee that the entire reach of Tecate Creek (11.56 km)
is in compliance with existing flood control regulations.
- The proposed 30-m wide flood-plain channel could be used to provide recreational space
for the benefit of the local population.
- A long-term plan for a Tecate river park that reconciles
hydrological, ecological, and economic objectives is envisioned.
|
|
REFERENCES
•
[Top]
[Introduction]
[Background]
[Methodology]
[Data Collection]
[Results]
[Conclusions]
[References]
Barnes, H. A. 1967. Roughness characteristics of natural channels. U.S. Geological Survey Water-Supply Paper 1849, Washington, D.C.
http://manningsn.sdsu.edu
California State Polytechnic University. 2003. A framework for an urban river environment: Tecate, Mexico. Studio 606, Pomona, California.
Centro de Estudios Sociales y Sustentables. 2004. Programa parcial de mejoramiento de la zona Río Tecate. Tijuana, Baja California, Mexico.
Chow, V. T. 1959. Open-channel hydraulics. McGraw-Hill, New York.
Natural Resources Conservation Service, 1990. TR-60: Earth dams and reservoirs. Washington, D.C.
Ponce, V. M. 1989. Engineering Hydrology, Principles and Practices. Prentice-Hall, Englewood Cliffs, New Jersey.
http://ponce.sdsu.edu/330textbook_hydrology_chapters.html
Ponce, V. M., H. A. Castro, A. E. Espinoza, R. Celis, and F. Perez. 2005. Flood hydrology of Tecate Creek, Tecate, Baja California, Mexico.
http://ponce.sdsu.edu/tecate_creek_flood_hydrology_report.html
Rhoda Arkhos Ingeniería S.C., undated. Estudio hidrólogico del Río Tecate.
U.S. Army Corps of Engineers. 2002. River Analysis System (HEC-RAS), Hydrologic Engineering Center, Davis, California, Version 3.1, November.
http://www.hec.usace.army.mil/software/hec-ras/hecras-hecras.html
|
|
Fig. 16 Tecate Creek, in Tecate, Baja California.
|
|
http://ponce.sdsu.edu/tecate_creek_flood_hydraulics_report.html
|
060710
|
|
|
|
|
|