|
|
|
CHAPTER 12: SNOW HYDROLOGY |
|
"There are certain plant species which habitually feed on ground water and others which do not. In arid regions, there is a real and conspicuous distinction between the two groups." Oscar E. Meinzer (1927) |
|
This chapter is divided into five sections. Section 12.1 describes the processes leading to snow formation and accumulation; Section 12.2 describes the processes responsible for melting of the snowpack; Section 12.3 deals with snowmelt indexes and their use in snowmelt computations; Section 12.4 discusses the effect of snowpack condition on runoff; and Section 12.5 describes the synthesis of snowmelt hydrographs. See Section 3.2 for a description of snowpack measurements. |
12.1 SNOW FORMATION AND ACCUMULATION
|
|
Snow hydrology studies the properties of snow, its formation, distribution, and measurement, including snowmelt and snowmelt-generated runoff.
In many areas of the United States and the world, snow is a major contributor to streamflow, especially in regions of high altitude and/or temperate climate.
For these regions, a knowledge of snowfall and snowmelt is necessary for the assessment of the seasonal variability of streamflow.
In turn, snowfall and snowmelt are governed by meteorological principles.
The atmosphere is the source of moisture for snowfall, and it regulates a basin's energy exchange, which determines snowmelt.
Principles of snow hydrology are useful in design and operation of engineering projects.
Typical problems are the following:
- The evaluation of the amount of water stored in the snowpack and its relation to the hydrologic balance of a catchment.
- The evaluation of snowmelt rates, including the physical causes for snowmelt.
- The evaluation of the effect of snowpack on runoff, both from snowmelt and rain on snow.
For project design, fixed sequences of meteorologic and hydrologic conditions are selected based ori the overall functional requirements of the project.
On the other hand, project operation requires evaluation of specific meteorologic and hydrologic conditions, and associated streamflow forecasts for both short- and long-term periods.
Snow Formation
The major atmospheric and environmental factors responsible for snow formation are: (1) surface air temperature, (2) elevation, and (3) terrain features.
Temperature
Surface air temperature, measured at approximately 4-ft (1.2-m) depth, is considered to be a reliable indicator of the presence or absence of snow.
A study of the effect of surface air temperature on snow formation was reported in Snow Hydrology, the U.S. Army Corps of Engineers Summary Report of Snow Investigations [10].
In this study, some 2400 occurrences of precipitation in Donner Summit, California (elevation 7200 ft), ranging from 29°F to 40°F (-2°C to 4°C) were analyzed to determine the effect of surface air temperature on the form of precipitation, either (a) rain, (b) snow, or (c) mixed rain and snow.
The results, summarized in Table 12-1, show that precipitation occurs in the form of snow when the surface air temperature is approximately less than 35°F (1°C).
| |||||||||||||||||||||||||||||||||||||||||||||||||||||||||||||||||
Elevation
The same study concluded that elevation is an important variable in snow formation.
Precipitation data indicated that snowstorms accounted for approximately 95 percent of all precipitation events at 7000 ft (2100 m), 50 percent at 4000 ft (1200 m), and 1 percent at 1000 ft (300 m).
While these data were obtained in the central Sierra Nevada of California, at 39°N latitude, they are believed to be representative of regions along the windward side of major mountains ranges in the United States and Canada.
A tendency for an increase in snowstorms with an increase in latitude was also documented.
Terrain Features
In leveled (i.e., flat) terrain, the distribution of precipitation is a function solely of atmospheric variables.
Conversely, in orographic regions, precipitation is also a function of the character of the terrain.
For a satisfactory evaluation of precipitation in orographic regions, the relationship of terrain to meteorologic conditions must be examined.
The effects of terrain on precipitation are classified as either: (a) small scale or (b) large scale.
Studies of small-scale orographic effects have shown that the water equivalent of the snowpack (Section 3.2) is a function of: (1) elevation, (2) slope, (3) exposure, and (4) southern aspect.
The California data in Snow Hydrology supported the following conclusions regarding water equivalent:
An increase of 1.0-2.5 in. (2.5-6.3 cm) for each 100 ft (30 m) increase in elevation.
A decrease of 0.2-0.5 in. (0.5-1.2 cm) for each 1 percent increase in slope.
A decrease of 0.5-0.75 in. 0.2-1 .8 cm) for each 10° increase in exposure sector. An exposure sector is the sector of a circle of 0.5-mi radius, centered at the snow course, within which there is no land higher than the points in the snow course.
An increase of 0.25-1.0 in. (0.6-2.5 cm) for each 10° deviation from southern aspect.
Spreen [9], using data from western Colorado, correlated average winter precipitation to large scale orographic features.
He used elevation, slope, exposure, and orientation as independent variables and concluded that together they account for a high percentage of the precipitation variability in that area.
Although general qualitative estimates can be deduced from these studies, values for individual basins or regions are likely to vary widely.
Snow Accumulation
Snow accumulation is a function of the following atmospheric and environmental conditions: (1) surface air temperature, (2) elevation, (3) slope and aspect of terrain, (4) wind, (5) energy and moisture transfer, and (6) vegetative cover.
Temperature
The temperature at the time of snowfall controls the dryness of snow and, therefore, its susceptibility to erosion by wind.
On mountain slopes, an increase in snowcover is usually associated with a temperature decrease with an increase in elevation.
Wet snow falls where temperatures are close to the melting point, usually in the proximity of large bodies of water.
Conversely, dry snow is typical of the continental interiors, where colder temperatures prevail.
Elevation
In mountainous regions, elevation is considered to be the most important factor affecting snowcover distribution.
Often a linear relationship between snow accumulation and elevation can be found for specific sites and elevation ranges.
Since snow accumulation is a function not only of elevation but also of slope, exposure, aspect, and so on, these linear relationships tend to reflect local conditions.
Slope
Orographic precipitation rate is largely a function of terrain slope.
If the air is saturated, the rate at which precipitation is produced is proportional to the rate of ascent of the air mass.
Rhea and Grant [8] analyzed Colorado winter precipitation data and concluded that the long-term average of orographic precipitation at a point was strongly correlated with the topographic slope computed over the first 20 km upwind of the point.
Aspect
The importance of aspect on snow accumulation is shown by the large differences between snowcover amounts found on windward and leeward slopes of coastal mountain ranges.
The influence of aspect is related to the direction of snowfall- producing masses, the frequency of snowfall, and the energy exchange processes influencing snowmelt.
However, the effect of aspect on snow accumulation tends to be much less than that of elevation [7].
Wind
Wind is responsible for the movement of snow particles, changing their shape and physical properties and depositing them into drifts or banks of greater density than the parent material.
A loose snow cover, with particles 1 to 2 mm in diameter is readily entrained by fairly light winds of about 10 km/ h [4].
The formation of a glaze by the freezing of surface melt may inhibit transport by wind; however, very strong winds may move even large sheets of glazed snow.
Erosion prevails at locations where the wind accelerates (at the crest of a ridge), and deposition occurs where the wind decelerates (along the edges of forests and cities).
The rate of snow transport by wind is greatest over flat, extensive open areas and least in areas exhibiting great resistance to flow (forests and cities).
Energy and Moisture Transfer
During the winter months, energy and moisture transfers to and from the snowcover are responsible for changes in its state.
Radiation fluxes are primarily responsible for changes in depth and density of the snowpack.
The underlying surface, the physical properties of the snowcover, vegetation, buildings, roads, and other cultural features affect the net radiation flux reaching the snow, changing its erodibility, mass and state.
The net radiation is a function of the snowcover's albedo, the ratio of reflected to incident shortwave radiation.
Typical values of albedo for different snowcover surfaces vary from 0.8 for exposed surfaces to 0.12 under extensive coniferous forest cover.
Vegetative Cover
Vegetation influences the surface roughness and wind velocity, thereby affecting the erosional, transport, and depositional characteristics of the surface.
When vegetation extends above the snowcover it affects the process of energy exchange and the amount of snow reaching the ground.
A forest provides a large intercepting and radiating biomass above the snowcover surface.
Studies have revealed that more snow is usually found on forest openings than within the forest stands.
In addition to modifying wind velocity and providing additional interception, a forest acts to modify the energy exchange processes that affect the snowcover's erodibility, mass, and state.
Distribution of Snowcover
The extent of snowcover is directly related to altitude, since temperatures near or below freezing affect both the frequency of snowfall and the probability of snowmelt.
On a global basis, the duration of snowcover is longest near the poles and on high mountain ridges.
Snowcover may form and disappear several times within a season.
At high latitudes, a long period of winter snowcover is virtually assured (exceeding 180 d in continental areas north of 60°N).
At lower latitudes, snowcover may form briefly before melting.
Due to the ephemeral nature of early and late seasonal snowstorms, it is often difficult to determine the length of the seasonal snowcover period.
Grasslands
Snowcover usually forms on the colder, continental grasslands of the Northern Hemisphere starting in November.
In the southern Great Plains of North America, the snowcover becomes permanent in December or January.
The characteristics of permanent snow cover are largely a function of air temperature.
Seasonal snowcover periods vary from 120 to 160 d in the northern grasslands and 30 to 60 d in Oklahoma, to only a few days in Texas.
The mean annual accumulated snowcover depth in grasslands is in the range of 20 to 50 cm, with a density of approximately 20 percent (200 kg/m3) [4].
Mixed Forests
In the mixed forests of the Northern Hemisphere, snowcover usually forms in late November or December and recedes in two directions: from the south during February and from the north in late March or early April.
Predictions of length of snowcover are unreliable because the cover does not remain on the ground for long periods.
The average snowcover density is 20 percent, increasing progressively over the winter to 30 percent by late March.
Mountain Areas
Snow exists on most high mountain ridges every month of the year at elevations that vary with altitude and climate.
The snowcover on rugged mountain terrain is highly variable due to its exposure to slides and wind action.
Tundra conditions (i.e., those typical of forest-free arctic and subarctic regions) prevail at the higher elevations, with the snowcover undergoing severe erosion and wind packing resulting in the formation of slabs.
12.2 MELTING OF THE SNOWPACK
|
|
Snowmelt is the product of several heat transfer processes acting on the snowpack.
Moreover, the quantity of snowmelt is a function of the condition of the snowpack itself.
Therefore, snowmelt determinations are quite complex, and certain simplifying assumptions are necessary for practical applications.
The heat-transfer processes acting on the snowpack vary with time and location.
Solar radiation, for example, is relatively important in the central plains of the United States but not in the Pacific Northwest.
Solar radiation is also more important during the spring than during the winter, while its role diminishes with an increase in latitude.
No single method for computing snowmelt is applicable for all regions and seasons.
A thorough understanding of the snowmelt process is necessary to select the best method for a given location and time of the year.
Snowpack Energy Balance
The principal sources of heat energy involved in the melting of the snowpack are the following [12]:
- Net shortwave (i.e., solar) radiation, Hs,
- Net long-wave (i.e., terrestrial) radiation, Hl,
- Convective heat transfer from atmosphere to snowpack, Hc,
- Heat transfer caused by condensation of water vapor onto snowpack, He,
- Heat transfer from rainwater to snowpack, Hp, and
- Heat conduction from underlying ground to snowpack, Hg.
Each of these items is a function of several factors.
For instance, net shortwave radiation is the difference between incident and reflected solar radiation.
Net longwave radiation loss is the difference between the radiation emitted by the snowpack and the portion of it reflected back by the atmosphere.
Radiation melt is the snowmelt due to the combined effect of shortwave and long-wave radiation, i.e., all-wave radiation.
Convective melt is the snowmelt caused by convective heat transfer from atmosphere to snowpack.
Condensation melt is the snowmelt caused by condensation of water vapor onto snowpack.
Rain melt is the snowmelt caused by heat transfer from rainwater to snowpack.
Ground melt is the snowmelt caused by heat conduction from the ground to snowpack.
Snowmelt Heat Equivalent
Snowmelt heat equivalent is the total amount of heat energy involved in snowmelt.
It is calculated as follows:
| Hm = Hs + Hl + Hc + He + Hp + Hq | (12-1) |
in which Hm = snowmelt heat equivalent.
In Eq. 12-1, Hs is positive, Hl is usually negative in the open (i.e., long-wave radiation loss), Hc is usually positive, He may be either positive or negative, and Hp and Hg are almost always positive.
Thermal Quality of the Snowpack
The amount of snowmelt produced by a given amount of heat energy is a function of the thermal quality of the snowpack.
Thermal quality is the ratio of the heat necessary to produce a given amount of water from the snowpack to the heat necessary to produce the same amount of water from pure ice, expressed as a percentage.
At temperatures below freezing the thermal quality of snow is greater than 100 percent.
Conversely, the thermal quality of snow containing free water is less than 100 percent.
A ripe snowpack is one that is at 0°C temperature and holds water only by adsorption and capillarity.
The thermal quality of a ripe snowpack is approximately 97 percent [10].
Rate of Snowmelt
For a snowpack with a thermal quality of 100 percent, the latent heat of fusion is 80 cal/g.
At 0°C, the density of water is approximately equal to 1 g/cm3.
Therefore, for a snowpack of a thermal quality of 100 percent, the heat required to produce 1 cm of melt is 80 cal/cm2, or 80 langleys.
In general, for a snowpack with a thermal quality of B%, the heat required to produce 1 cm of melt is: 80(B/100) ly = (B/1.25) ly.
Therefore, the snowmelt rate can be calculated as follows:
|
1.25 Hm M = __________ B | (12-2) |
in which M = snowmelt rate in centimeters per day, Hm = snowmelt heat equivalent in langleys per day (ly/d), and B = thermal quality of the snowpack in percent.
Similarly, the snowmelt rate associated with each of the heat energies of Eq. 12-1 can be calculated.
For instance, Ms = 1.25(Hs/B), in which Hs is the net shortwave radiation and Ms is the snowmelt rate due to shortwave radiation.
Solar Radiation
Only an infinitesimally small portion of all the radiant energy emitted by the sun reaches the earth, yet this small portion is the ultimate source of all the Earth's energy.
The amount of solar energy intercepted by the Earth varies with the solar output and with the seasons.
These variations, however, are quite small.
The solar constant is the intensity of solar radiation received on a unit area of a plane normal to the incident radiation at the outer limit of the earth's atmosphere, with the earth at its mean distance from the sun.
The value of the solar constant is generally taken to be 1.94 ly/min, although variations in the range of 1.90-2.00 ly/min have been reported [10].
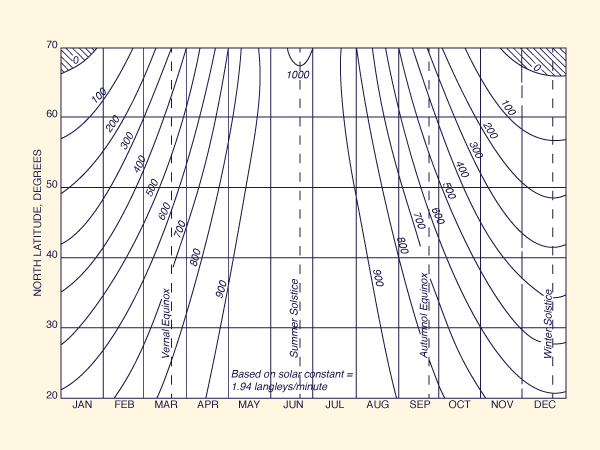
The amount of solar radiation incident on a horizontal surface is referred to as insolation.
Daily insolation amounts received at the outer limit of the earth's atmosphere can be calculated from the solar constant for any given latitude and time of the year, as shown in Fig. 12-1.
These insolation amounts are subject to reflection, scattering, and absorption by the atmosphere.
In the absence of clouds, and barring unusual atmospheric conditions, the amounts reflected, scattered or absorbed are quite constant and relatively small.
Variations in these amounts are caused primarily by variations in the content of water vapor and dust in the atmosphere.
Figure 12-1 Insolation at the outer limit of the earth's atmosphere as a function of latitude |
The amount of insolation reaching the earth's surface is a function of the atmospheric transmission coefficient:
|
Ic Ca = _____ Io | (12-3) |
in which Ca = atmospheric transmission coefficient; Ic = insolation reaching the earth's surface under clear sky; and Io = insolation reaching the outer limit of the earth's atmosphere.
Atmospheric transmission coefficients include direct solar radiation and diffuse sky radiation, i.e., the scattered radiation that manages to reach the earth's surface.
Therefore, an increase in diffuse sky radiation causes an increase in atmospheric transmission coefficients.
The albedo of the earth's surface has a direct bearing on diffuse sky radiation.
Other things being equal, the greater the albedo, the greater the diffuse sky radiation.
The relatively high albedo of snow surfaces results in increased diffuse sky radiation.
During the winter, the higher albedos associated with new-fallen snow (A = 0.8) cause a substantial increase in diffuse sky radiation.
During the summer, the increase is attenuated by the lower albedos of the older snow (A = 0.4).
Effect of Clouds
By far the largest variations in the portion of solar radiation transmitted by the atmosphere are caused by clouds.
The transmitted radiation varies with type, height, density, and cloud cover.
The cloud cover coefficient is defined as follows:
|
I Cc = _____ Ic | (12-4) |
in which Cc = cloud cover coefficient; I = insolation reaching the earth's surface under cloud cover; and Ic = insolation reaching the earth's surface under clear sky.
The cloud cover coefficient can be related to cloud height and amount of cloud cover as follows [5]:
| Cc = 1 - [ 0.82 - (0.024) Z ] N | (12-5) |
in which Z = cloud height in thousands of feet; and N = amount of cloud cover, the ratio of area of cloud cover to area of sky.
The effect of the reflectivity of the earth's surface on the amount of diffuse sky radiation is more pronounced for a cloudy sky than for a clear sky.
Not only is the ratio of diffuse sky radiation to direct solar radiation increased by the presence of clouds, but also the diffuse sky radiation reflected by the snow surface is strongly rereflected by the clouds.
Thus, for a given cloud height and amount of cloud cover, the cloud cover coefficient of snow-covered areas is greater than that of snow-free areas.
Effect of Slope
In the Northern Hemisphere, the radiation incident on south-facing slopes exceeds that incident on north-facing slopes.
During the spring the slope effect is slight, but during the winter it is more pronounced.
At any given instant, the radiation on a sloping surface (relative to the radiation on a horizontal surface) may be determined from the geometry of the individual situation (the slope and its aspect, and the solar altitude and azimuth) [10].
Effect of Forest Cover
The effect of forest cover on the amount of insolation reaching the ground is a function of density, type, and condition of the forest.
To evaluate the effect of forest cover, a forest transmission coefficient is defined as follows:
|
If Cf = _____ Ic | (12-6) |
in which Cf = forest transmission coefficient; If = insolation reaching the earth's surface under forest cover; and Ic = insolation reaching the earth's surface under clear sky.
For deciduous forests, the insolation amount is affected by the large seasonal variability in forest transmission coefficients.
However, for coniferous forests, the variability is quite small throughout the year, and therefore average values are appropriate.
For coniferous forests, transmission coefficients are inversely related to the density of forest canopy, i.e. the ratio of area covered by forest canopy to total area.
Measurement of Insolation
Insolation is measured with a pyranometer, an instrument consisting of a vacuum bulb, in the center of which is a disk having a white center and concentric black and white bands.
An electromagnetic force is produced, which is proportional to the temperature difference between the rings and hence to the radiation incident upon them.
The electromagnetic force is recorded with a potentiometer calibrated to measure radiation intensity.
In the United States, insolation is measured in selected first-order stations operated by the National Weather Service.
Insolation data may be available through the National Climatic Data Center, Asheville, North Carolina.
Albedo of a Snowpack
The albedo of a snowpack may vary widely, ranging from 0.4 for a ripe, granular snowpack, to 0.8 or more for new-fallen snow.
The albedo is primarily a function of the condition of the surface layers of the snowpack.
It is measured by means of two pyranometers, one measuring the insolation received and the other measuring the shortwave radiation reflected by the snowpack.
The variation of albedo with temperature index (summation of daily maximum temperatures since last snowfall) is shown in Fig. 12-2.
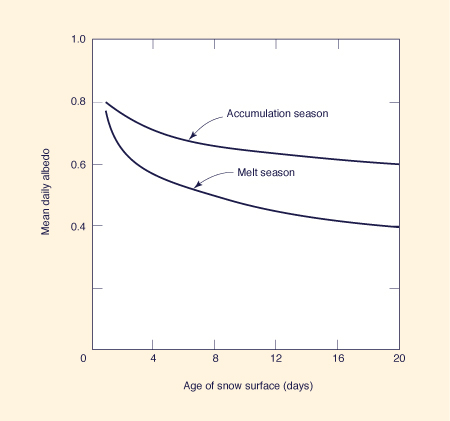
Also, there is a tendency for a decrease in albedo from the accumulation season (new snow) to the melt season (older snow).
Figure 12-3 shows the seasonal reduction in albedo.
Figure 12-2 Variation of albedo with temperature index [10]. |
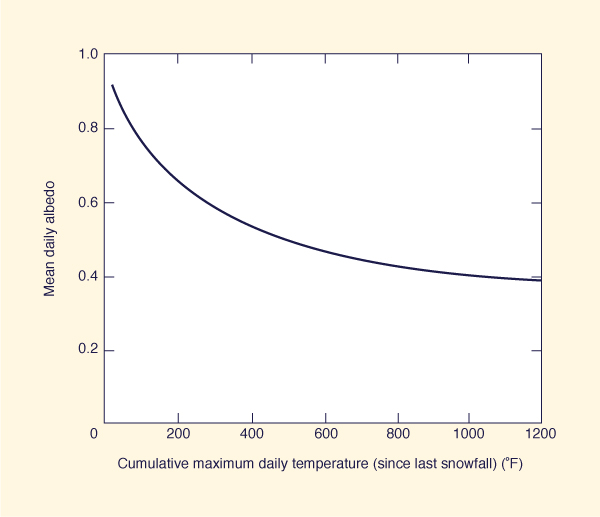
Figure 12-3 Seasonal reduction in albedo from accumulation to melt seasons [10]. |
Shortwave Radiation Melt
Following Eq. 12-2, the shortwave radiation melt is calculated as
|
1.25 Hs Ms = __________ B | (12-7) |
in which Ms = shortwave radiation melt rate in centimeters per day; Hs = net shortwave radiation in langleys per day; and B = thermal quality of the snowpack in percent.
The net shortwave radiation is equal to:
| Hs = I (1 - A) | (12-8) |
in which I = insolation reaching the earth's surface, in langleys per day, after appropriate correction for cloud cover, slope, and forest cover; and A = albedo.
Snowmelt Computations
Snowmelt computations are accomplished by disaggregating the snowmelt process into the following melt components: (1) all-wave radiation melt, (2) convection melt, (3) condensation melt, (4) rain melt, and (5) ground melt.
All-wave Radiation Melt
The effects of shortwave and long-wave radiation are usually combined into an all-wave radiation melt.
During clear weather, the important variables in radiation melt are: (1) insolation, (2) albedo, and (3) air temperature.
The humidity of the air also affects the radiation melt; however, its effect is relatively minor compared to the other three variables.
Figure 12-4 illustrates the daily radiation melt (inches per day) for the central Sierra of California as a function of albedo and air temperature, for (a) spring conditions, with insolation of 800 Iy/ d, and (b) winter conditions, with insolation of 400 ly/ d.
In Fig. 12-4(b), negative melts are shown as dashed lines.
Figure 12-4 Variation of radiation melt with albedo and air temperature: (a) spring; (b) winter [10]. |
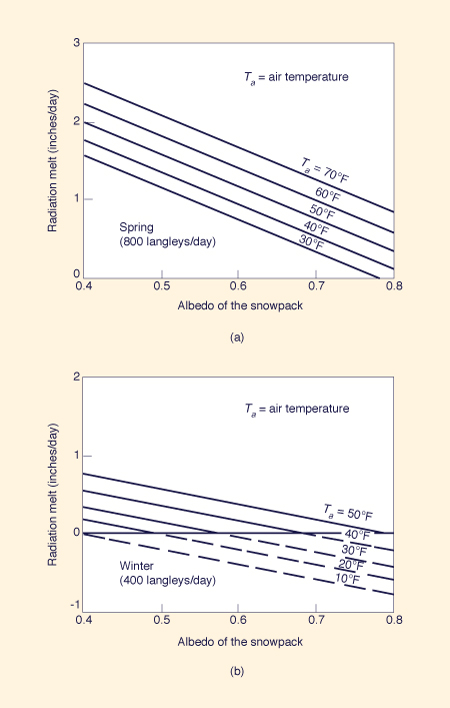
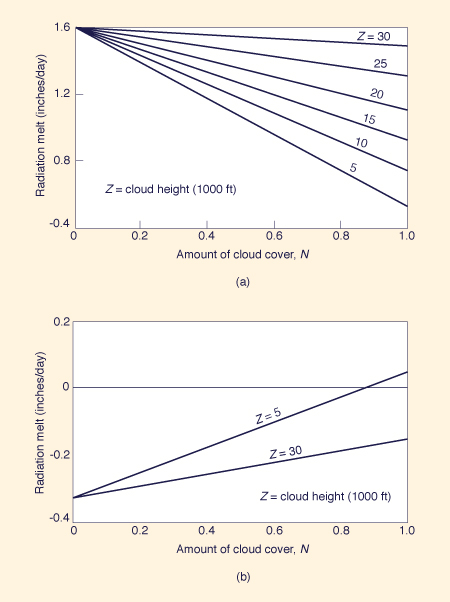
Figure 12-5 illustrates the effect of clouds on daily radiation melt during: (a) spring (May 20), and (b) winter (February 15).
It should be noted that the effect of cloud height and cloud cover on radiation melt is less during the winter than during the spring.
Also, notice the trend of the function representing radiation melt versus cloud cover varying from winter to spring.
During the spring, they are inversely related, whereas during the winter they are directly related.
The winter reversal is largely due to the increased role of long-wave radiation during this time of the year.
Figure 12-5 Variation of radiation melt with cloud height and cloud cover: (a) spring; (b) winter [10]. |
The forest canopy exerts a large influence on the combined radiation exchange between the snowpack and its environment.
However, its effect differs from that of clouds, particularly with respect to shortwave radiation.
While both clouds and trees restrict the transmission of insolation, clouds are highly reflective, whereas the forest canopy absorbs most of the insolation.
This causes the forest canopy to warm up, releasing to the snowpack a portion of the incident shortwave radiation energy.
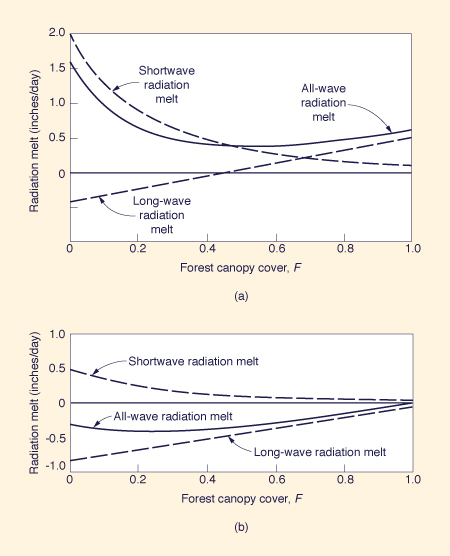
Figure 12-6 illustrates the effect of forest canopy cover on daily radiation melt during (a) spring and (b) winter.
The relations shown in this figure represent typical seasonal radiation snowmelt conditions in the middle latitudes under a coniferous forest cover.
During the spring the maximum radiation melt occurs in the open (for zero percent canopy cover), while in the winter the maximum radiation melt occurs with 100 percent canopy cover.
Figure 12-6 Variation of radiation melt with forest canopy cover: (a) spring; (b) winter [10]. |
Convection Melt
Unlike radiative heat transfer, convective heat transfer from atmosphere to snowpack cannot be measured directly.
An empirical expression for convection melt rate is
| Mc = kc vb (Ta - Ts) | (12-9) |
in which Mc = convection melt rate, Ta = mean air temperature, Ts = snow surface temperature, vb = wind speed, and kc = convective melt coefficient.
With temperatures in degrees Celsius, wind speed at 15 m above ground level in kilometers per hour, and Mc in centimeters per day, the value of kc is equal to 0.01137 [1].
Condensation Melt
The rate of condensation of water vapor onto the snow or ice surface may be important, particularly under conditions of rapid melt.
At 0°C, the latent heat of vaporization (or condensation) is 597.3 cal/g.
Compared with the latent heat of fusion (80 cal/g), this means that the volume of water available for runoff is approximately 7.5 times the volume of water actually condensed.
The amount of condensate can be related to vapor pressure and wind speed in the following way:
| qe = ke vb (ea - es ) | (12-10) |
in which qe = amount of condensate, ea = vapor pressure of the air, es = vapor pressure of the snow surface, vb = wind speed, and ke = a coefficient.
For every unit of water vapor condensed, the additional heat of vaporization released is capable of melting 7.5 times this amount of snow.
Therefore, the condensation melt equation becomes:
| Me = 8.5 ke vb (ea - es) | (12-11) |
in which Me = condensation melt, which includes melt plus condensate.
Rain Melt
When rain falls on a snowpack, a certain amount of heat is transferred to the snow.
For snowpacks at 0°C, this heat transfer produces snowmelt, whereas for colder snowpacks it causes a rise in snow temperature.
The amount of heat released is directly proportional to the quantity of rainwater and to its temperature excess above that of the snowpack.
Considering a melting snowpack, 1 cal of heat is available for every gram of rainwater and for every degree in excess of 0°C.
This leads to
| Hp = ( Tr - Ts ) Pr | (12-12) |
in which Hp = heat released by rainwater in langleys, Tr = rainwater temperature in degrees Celsius, Ts = snowpack temperature in degrees Celsius, and Pr = rainwater depth in centimeters.
Therefore, following Eq. 12-7. the rain melt is:
|
1.25 ( Tr - Ts )Pr Mp = _________________ B | (12-13) |
in which Mp = rain melt in centimeters, and B = thermal quality of the snowpack in percent.
To illustrate, 1 cm of water at 5°C produces 0.0625 cm of rain melt on a snowpack of 100 percent thermal quality (Ts = 0°C).
Ground Melt
The conduction of heat from the underlying ground becomes important in snowmelt computations when the melt season as a whole is considered.
This source of heat can cause melting during the winter and early spring when melt at the snow surface may be nonexistent.
Ground melt is capable of priming the underlying soil prior to the melt season and may also help to ripen the snowpack, readying it for melt.
Measurements in the central Sierra of California indicate that ground melt rates vary throughout the melt season, with a tendency to increase as the season progresses [10].
The total ground melt during the month of January was measured as 0.28 cm; during May, 2.44 cm.
The seasonal ground melt (for a total of 160 d) was measured at 8.28 cm, which translates into an average ground melt rate of 0.05 cm/d.
These results, while not universally applicable, are generally indicative of the magnitude and seasonal variation of ground melt.
Total Melt
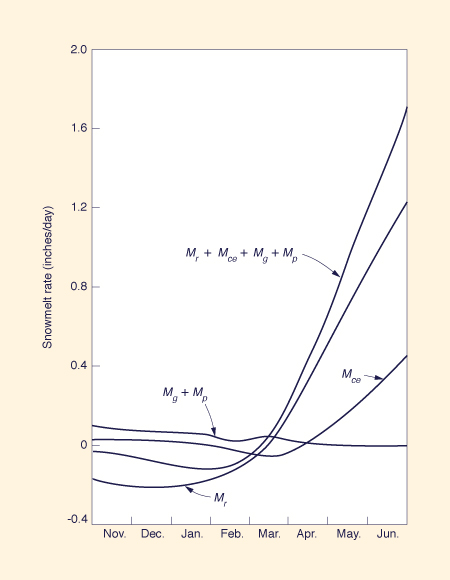
The various melt components-radiation, convection, condensation, rain and ground melts-can be summed up to obtain the variation of total melt with time of the year, as shown in Fig. 12-7 for the California data included in Snow Hydrology.
The following conclusions can be drawn from Fig. 12-7:
- The radiation melt (Mr) is negative during the winter and increasingly positive during the spring.
- The sum of convection and condensation melts (Mce) is very close to zero during the winter and increasingly positive during the spring.
- The sum of ground melt (Mg) and rain melt (Mp) is very close to zero during both winter and spring.
- The total melt (Mr + Mce + Mg + Mp) is close to zero during the winter and increasingly positive during the spring.
Figure 12-7 Variation of melt components amd total melt with time of the year [10]. |
12.3 SNOWMELT INDEXES
|
|
In hydrologic practice, an index is a readily measured meteorologic or hydrologic varariable that is related to a physical process in need of monitoring and whose variability can be used as a measure of the variability of the physical process.
The reliability of an index depends upon: (1) its ability to depict the variability of the physical processes, (2) its spatial and temporal variability, (3) its random variability, and (4) the quality and representativeness of its measurements.
Temperature indexes have been widely used to estimate snowmelt runoff.
Temperature was used because it was generally regarded as the best index of the heat transfer processes associated with snowmelt and because it was-and in many cases will continue to be-the only reliable and regularly available meteorological data.
Substantial improvements in the understanding of snowmelt processes have led to the use of alternative snowmelt indexes.
For instance, studies have shown that all-wave radiation is the controlling factor for snowmelt runoff from an open site.
When all-wave radiation data is not available, estimates of shortwave and long-wave radiation can be summed up to obtain an estimate of all-wave radiation.
Duration-of-sunshine data can be used as an index of shortwave radiation, with the appropriate albedo estimates to determine the net shortwave radiation.
Air temperature data can be used as an index of long-wave radiation exchange.
However, air temperature alone is generally a poor index of snowmelt runoff from an open site.
For forested areas, convection and condensation melts are by far the most important components in snowmelt runoff, largely because of the relation to the longwave radiation exchange in the forest environment.
The usual convection parameter is the product of daily maximum temperature and 12-h diurnal wind travel.
The usual condensation parameter is the product of vapor pressure and 12-h diurnal wind travel.
Therefore, accurate determinations of wind and vapor pressure are necessary for the evaluation of convection and condensation melt.
In the absence of wind and vapor pressure data, maximum daily air temperature can be used as an index to provide a fair estimate of daily melt for forested areas.
Likewise, for heavily forested areas, either maximum daily or mean daily air temperature combined with vapor pressure are about equally effective as indexes of daily melt.
General Equation for Snowmelt Runoff in Terms of Indexes
The general equation for snowmelt runoff in terms of indexes is
|
7
M = a + Σ bi Xi i = 1 | (12-14) |
in which M = snowmelt runoff in centimeters per day (or inches per day), a = regression constant, bi = regression constants, and Xi = snowmelt indexes described in Table 12-2.
| ||||||||||||||||||||||||||||||||||||
Not all seven indexes are always significant for a particular basin.
Typically, a regional snowmelt runoff equation is based on two or three indexes.
For instance, a snowmelt runoff equation for the Boise River above Twin Springs, Idaho, is the following [10]:
| M = -1.89 + 0.0245 T + 0.00238 G | (12-15) |
in which M = snowmelt runoff over snow-covered area in inches per day, T = maximum daily temperature at Boise, Idaho, and G = net all-wave radiation exchange in the open in langleys per day.
Temperature Indexes
In many areas where snowmelt is an important contributor to runoff, air temperature measurements are the only data available from which snowmelt can be computed.
Moreover, air temperature is regarded as the best single snowmelt index for forested areas.
For these reasons, temperature indexes are the most widely used method of computing snowmelt.
A commonly used temperature index is degree-days above a chosen temperature base, obtained by counting the number of degrees above the temperature base for each day in which the temperature remains above the temperature base.
Usually, mean daily temperature (i.e., the mean of maximum daily and minimum daily temperatures) is used in calculating the number of degree-days.
The freezing level (0°C) is normally chosen as the temperature base.
For certain applications, however, maximum daily temperature may be used in lieu of mean daily temperature.
Moreover, a temperature other than freezing is sometimes used as the temperature base.
A widely used snowmelt indicator is the degree-day factor, a unit melt rate defined as the number of centimeters (inches) of melt per degree-day.
Its units are either centimeters per degree Celsius-day [cm/(0°C-d)] or inches per degree Fahrenheit-day [in./(0°F-d)], with 1 in./(°F-d) = 4.57 cm/(0°C-d).
Point Melt Rates
Early investigations of temperature indexes focused on point melt rates.
Horton [6] performed experiments wherein cylinders of snow were cut from the snowpack and melted under laboratory-controlled temperature conditions.
He found the degree-day factor to be in the range 0.04-0.06 in./(°F-d).
Clyde [2] performed similar experiments and determined average degree-day factors in the range 0.05-0.07 in/(0°F-d).
Church [3], using actual data from Soda Springs, California, obtained a degree-day factor of 0.051 in./(°F-d).
In the Snow Hydrology report, values of degree-day factors ranging from 0.06 to 0.106 in./(°F-d) were obtained from measurements at three sites, with a mean of 0.085 in./(°F-d) [10].
Basinwide Snowmelt
Although point melt rates are usually restricted within a relatively narrow range, their extrapolation to basinwide snowmelt rates is complicated because of the spatial and seasonal variability of snow cover.
During the snowmelt season, the progressive retreat of the snow line results in a gradual change in mean elevation of the snow-covered area.
Furthermore, only a part of the snow-covered area may be contributing to snowmelt.
For instance, in the Northern Hemisphere, the southerly exposed open areas tend to melt first, leaving the more sheltered areas to produce the last of the snowmelt.
These complexities contribute to making the basinwide evaluation of snowmelt quite a difficult undertaking.
A complete water balance is required so that the sources of snowmelt runoff can be properly identified.
Moreover, the areal extent of the snowpack needs to be determined.
Extensive studies of basinwide snowmelt runoff reported in Snow Hydrology resulted in the basinwide degree-day factors shown in Table 12-3.
The values shown are means for the several years of record in the three testing sites.
They reflect the general decrease in melt amounts with increasing forest cover, from the central Sierra in California to the Upper Columbia and Willamette basins in the Northwest.
They also reflect the general increase in melt as the melt season progresses, from April to May.
The April melt is shown to be generally less than the May melt because some of the April heat is consumed in ripening the snowpack rather than in melting it.
| ||||||||||||||||||||||||||||||||||
Generalized Basin Snowmelt Equations
A suitable mix of the relevant physical processes and statistical analyses was used in Snow Hydrology to develop generalized basin snowmelt equations.
These equations are based on commonly available meteorological data, with appropriate simplifications to enhance their practicality.
Equations for Rain�free Periods
The generalized basin snowmelt equations for rain-free periods are as follows [10]:
- For heavily forested areas:
M = 0.074 (0.53 T'a + 0.47 T'd) (12-16a) - For forested areas:
M = k (0.0084v ) (0.22 T'a + 0.78 T'd ) + 0.029 T'a (12-16b) - For partly forested areas:
M = k' (1 - F ) (0.004 Ii ) (1 - A) + k (0.0084 v ) (0.22 T'a + 0.78 T'd ) + F (0.029 T'a)
(12-16c) - For open areas:
M = k' (0.00508 Ii (1 - A) + (1 - N) (0.0212 T'a - 0.84) + N (0.029 T'c) + k (0.0084 v) (0.22 T'a + 0.78 T'c)
(12-16d)
in which
M = snowmelt rate in inches per day,
- T'a = difference between the air temperature at a 10-ft height and the snow surface temperature in degrees Fahrenheit,
T'd = difference between the dew point temperature at a 10-ft height and the snow surface temperature in degrees Fahrenheit,
v = wind speed at 50 ft above the snow in miles per hour.
Ii = observed or estimated daily insolation in langleys,
A = observed or estimated average snow surface albedo, expressed as a decimal fraction,
k' = basin shortwave radiation melt factor, which depends on the average exposure of open areas compared to an unshielded horizontal surface; for south slopes, it varies between 1.1 in the summer solstice to 2.4 in the winter solstice,
F = estimated average basin forest canopy cover, effective in shading the area from solar radiation, expressed as a decimal fraction,
T'c = difference between the cloud base temperature and the snow surface temperature in degrees Fahrenheit,
N = estimated cloud cover, expressed as a decimal fraction, and
k = basin factor, a function of basin topographic characteristics and exposure to wind, varying from about 0.2 for densely forested areas to slightly over 1.0 for exposed ridges and mountain passes (for plain areas with no forest cover, k = 1.0).
Equations for Periods with Rainfall
The generalized basin snowmelt equations for periods with rainfall are as follows [10]:
- For open or partly forested basins:
M = (0.029 + 0.0084 k v + 0.007 Pr) ( Ta - 32) + 0.09 (12-17a) - For heavily forested areas:
M = (0.074 + 0.007 Pr) ( Ta - 32) + 0.05 (12-17b)
in which Ta = temperature of saturated air at a 10-ft height in degrees Fahrenheit; Pr = rainfall rate in inches per day; and k, v, and M have been previously defined.
12.4 EFFECT OF SNOWPACK CONDITION ON RUNOFF
|
|
Character of the Snowpack
Snow is composed of ice crystals, which are formed in the atmosphere at temperatures below freezing by sublimation of water vapor on hygroscopic nuclei.
There are many different types of snow crystals, depending on the shape of the nucleus, the rate of sublimation, and the temperature of the air.
Due to the usual dendritic structure of snow crystals, new-fallen snow is generally of low density.
With time, however, the snowpack density increases.
The change from a loose, dry, subfreezing, low-density snowpack to a coarse, granular, moist, high-density snowpack is referred to as the ripening or conditioning, of the snowpack.
A ripe snowpack is said to be primed to produce runoff.
Snowpack density can be used to characterize other physical properties of snowpack, including its thermal properties and its affinity for water.
Liquid Water in the Snowpack
Water exists in the snowpack in three forms:
-
Hygroscopic water, which is adsorbed as a thin film on the surfaces of snow crystals and is unavailable for runoff until the snow crystals have melted or changed in form.
-
Capillary water, held by surface tension in the capillary spaces around the snow particles, free to move under the influence of capillary forces but unavailable for runoff until the snow melts or the spacing between snow crystals changes.
-
Gravitational water, in transit through the snowpack under the influence of gravity, draining freely from the snowpack, and available for runoff.
Water moves within the snowpack in both vapor and liquid phases.
The amounts of water vapor are usually small compared to the amounts of liquid water.
The liquid-water-holding capacity of a snowpack is the sum of hygroscopic and capillary water, expressed in percent of snow by weight.
Any water in excess of the liquid-water-holding capacity moves in a generally downward direction driven by the gravitational force.
The snowpack is said to be dry when its temperature is below freezing.
At °C, the degree of wetness of the snowpack depends on its liquid-water-holding capacity and the availability of free water.
Winter rains or melt may bring the snowpack to its liquid-water-holding capacity.
Subsequent weather may change the character of the snowpack and, with it, its liquid-water-holding capacity.
A snow pack at 0°C has a liquid-water-holding capacity of approximately 2 to 5 percent, depending on (1) its density and depth, (2) the size, shape, and spacing of snow crystals, and (3) its structure.
The liquid-water-holding capacity of a snowpack can be related to its density, but the relationship is not immediately apparent.
Metamorphism of the Snowpack
The change in character with time, i.e., the metamorphism of the snowpack, determines to a large extent the amount of snowmelt and runoff.
Generally, for equal amounts of melt and hydrologic abstractions (losses), the generated runoff is a function of snowpack condition.
For instance, an initially cold (i.e., subfreezing) snow will freeze a certain amount of liquid water entering it, raising the temperature of the snow to the melting point.
Before releasing any free-draining water, the liquid-water-holding capacity of the snowpack needs to be satisfied.
If, however, the entire snowpack is already conditioned to yield water, all water inflow will pass through the snowpack to the ground without depletion.
Factors Affecting the Metamorphism of Snow
Time is the principal factor in the metamorphism of snow.
The physical processes contributing to the metamorphism of snow are: (1) heat transfer at the snow surface by radiation, convection, and condensation, (2) percolation of melt or rainwater through the snowpack, (3) internal pressure due to the weight of the snow, (4) wind, (5) temperature and water vapor variation within the snowpack, and (6) heat transfer at the ground surface.
These physical processes cause changes in the following properties of the snowpack: (1) density, (2) structure, (3) air, water, and heat permeability and diffusivity, (4) liquid- water-holding capacity, and (5) temperature.
Structure of the Snowpack
As each new layer of snow is deposited, its upper surface is subjected to the weathering effects of radiation, rain, and wind, its undersurface is subjected to ground heat, and its interior to the action of the percolating water and water vapor.
This results in the stratification of the snowpack, that is, it becomes a layered structure reflecting individual snowstorm deposits.
As the season progresses, the snowpack tends to become homogeneous with respect to temperature, liquid-water content, grain size, and density.
During the melt season, on clear nights, a relatively shallow surface layer cools considerably below 0°C due to the outgoing long-wave radiation.
Below this nocturnal snow crust, the snowpack remains at 0°C, and liquid water continues to drain as long as the snowpack water content remains above its liquid-water-holding capacity.
The thickness of the nocturnal crust is approximately 30 cm [10].
Heat Transfer Within the Snowpack
Heat transfer within the snowpack is among the processes responsible for its ripening or conditioning.
During the spring melt season, the snowpack is normally at a temperature of 0°C, except for the nocturnal crust, and any heat reaching the surface is converted to melt.
During the winter, however, the snowpack is often at temperatures below 0°C, and a certain amount of heat must be transferred from the surface and ground to the snowpack to meet the thermal deficiency before melting and runoff can occur.
In hydrologic applications, the thermal deficiency of the snowpack can be taken as a heat deficit or initial heat loss, which must be satisfied before runoff can take place.
Water Transmission Through the Snowpack
The condition of the snowpack determines the amount of storage and the rate of downward movement of water.
The temperature, size, shape, surface area, and spacing of the snow crystals, melt rates, and rainfall intensities control the retention and detention of water as it moves downward through the snowpack.
The time of travel of unprimed snow may be considerable, particularly when the snow is striated with ice planes that are flat or upwardly concave.
If a water course is established within the snowpack, the travel time may be relatively short, being largely a function of the snowpack depth.
Energy Required for Ripening the Snowpack
The energy required for ripening the snowpack is [10]:
|
Ts
Ec = ______ + fp 1.6 | (12-18) |
in which Ec = equivalent energy required to ripen the snowpack, in percent of melt energy, Ts = average snow temperature below 0°C (positive value), and fp = liquid-water-holding capacity in percent.
For instance, for Ts = -8°C, and fp = 2%, the energy required to ripen the snowpack is 7 percent of the energy required to melt it.
This energy is normally supplied during the transition between accumulation and melt periods, so that its effect on flows during the active melt season is relatively small.
During the winter, however, the energy required for ripening the snowpack may be an appreciable fraction of the available energy.
12.5 SNOWMELT HYDROGRAPH SYNTHESIS
|
|
The synthesis of snowmelt or rain-on-snow hydrographs differs in several respects from that of rainfall hydrographs.
For one thing, only a fraction of the basin may be covered by snow.
Furthermore, for rain-on-snow floods, the losses (i.e., the hydrologic abstractions) of snow-covered areas may be quite different from those of snow-free areas.
Elevation Effects
Elevation is an important factor in snowmelt hydrograph determinations.
Both rain and snow amounts tend to increase with elevation, whereas snowfall occurs more frequently at higher elevations.
Moreover, melt rates have a tendency to decrease with an increase in elevation.
Two approaches are used in taking into account elevation effects in snowmelt computations: (1) the elevation-band method, and (2) the rational method.
In the elevation-band method, the limiting (i.e., maximum and minimum) basin elevations are identified.
Several elevation bands are chosen within these limits, and the subareas comprised within each elevation band are measured.
Elevations limiting each band may be determined either by equal-elevation increments or by equal-area bands.
A sufficient number of bands should be chosen to assure a smooth variation in snowmelt, rainfall, and loss amounts.
Each elevation band is assumed to be either snowcovered or snow-free, melting or not melting, raining or not raining, and losing water through hydrologic abstractions at a constant rate.
Snowmelt, rainfall, and loss amounts are estimated for each elevation band.
The rational method treats the drainage basin as a unit, making corrections for snow-free subareas and subareas with snowfall during rain-on-snow storms.
In this approach, it is assumed that the snow-cover depletion progresses regularly upwards, from lower to higher elevations.
The contribution to snowmelt originates in the area between the snow line, the average elevation of the lower limit of the snow-covered area, and the melt line, the average elevation of the upper limit of snowmelt.
In the case of rain on snow, the contributing area for rainfall runoff has an upper limit at the elevation where the rain becomes snow.
Typically there are three distinct bands in the rational method: (1) a lower band where rain falls on snow-free ground, (2) a middle band where rain falls on snow-covered ground, and (3) an upper band where snow falls on snow-covered ground.
Effect of Melt Period
The melt period has an effect on the synthesis of snowmelt hydrographs.
Since snowmelt is diurnal in character, the daily snowmelt quantity is usually generated in less than 12 h.
For large basins, particularly those for which no regular diurnal pattern of streamflow increase is discernible, daily melt amounts may be considered as daily increments.
For smaller basins, especially those with faster response characteristics, the day may be divided into two 12-h or three 8-h increments, with all the melt attributed to one of the increments.
Rain-on-Snow Hydrographs
In rain-on-snow situations, the effect of the snow pack is twofold: (1) to add an increment of meltwater to rainfall and (2) to store and detain, in varying degrees, the rainwater and generated melt.
The latter effect substantially increases the difficulty of calculating rain-on-snow flood hydrographs.
Depending on the condition of the snowpack, rainwater may be stored by the pack or pass through without depletion.
A dry, subfreezing snowpack may be able to store considerable amounts of rainwater.
Moreover, a deep snowpack may contribute an additional storage effect because of the increased travel time required for water to pass through it.
On the other hand, a thoroughly conditioned snowpack may oppose very little resistance to the flow of water and may actually abet runoff by adding an increment of melt of its own.
More importantly, however, a conditioned snowpack may have helped maintain soil moisture at high levels, which may result in the complete conversion of snowmelt into runoff.
Between these two extremes lies an array of intermediate cases.
Therefore, a knowledge of the initial condition of the snowpack is essential for the proper synthesis of rain-on-snow hydrographs.
Spring Snowmelt Runoff Hydrographs
Spring snowmelt runoff hydrographs tend to vary with orographic patterns.
For instance, in the mountainous areas of the western United States, the annual spring snowmelt flood is caused by the sustained melting of deep snowpacks over a long period of time.
On the other hand, in the northern Great Plains of the United States, snowmelt floods occur often in early spring, triggered by the comparatively fast melting of shallow snowpack covering extensive areas.
Three approaches are used to synthesize spring snowmelt runoff hydrographs.
These are: (1) the elevation-band method, (2) the rational method, and (3) the one-step method.
Elevation-band Method
In this method, the basin is subdivided into several (n) elevation bands, and snowmelt, rainfall, and losses are computed separately for each band.
Melt and rain are assumed to be spatially uniform throughout each band, and the entire band is assumed to be either snow-covered or snow-free, and melting or not melting.
Snowmelt is computed by using temperature or other appropriate indexes.
Excess basin water available for runoff (in centimeters per day, inches per day, or other suitable rate units) is obtained by weighing rainfall, snowmelt, and losses in proportion to the individual band subareas:
|
n
Σ [(Pi + Mi - Li ) Ai ] i = 1 Me = _________________________ n Σ Ai i = 1 | (12-19) |
in which Me = excess basin water available for runoff, Pi = rainfall, Mi = melt, Li = losses, and Ai = band subarea. The summation is for each of n bands.
Rational Method
In this method the basin is treated as a unit, and excess basin water available for runoff (in centimeters per day, inches per day, or other suitable rate units) is calculated as follows:
The melt line is established as the average elevation above which the air temperature is below freezing.
The snow line is established as the average elevation of the lower limit of the snow-covered area.
The contributing area, i.e., the fraction of the basin contributing to snowmelt, is the area between melt and snow lines.
Mean basin melt rate is obtained by multiplying the calculated snowmelt rate by the ratio of contributing area to basin area.
Excess basin water available for runoff is equal to mean basin melt rate plus mean basin precipitation minus mean basin loss rate.
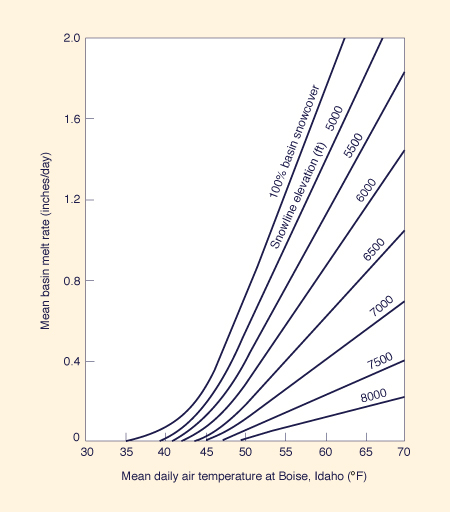
One-step Method
This method makes use of a chart showing mean basin melt rate as a function of mean daily air temperature and snowline elevation.
An example of this chart for the Boise River Basin above Twin Springs, Idaho, is shown in Fig. 12-8.
The chart is site-specific, with the size of contributing area implicit in it.
Excess basin water available for runoff is equal to mean basin melt rate plus mean basin precipitation minus mean basin loss rate.
Example 12-1.
Given the following rainfall, snowmelt. and losses data for a 950-km2 catchment, calculate the excess basin water available for runoff by the elevation-band method.
The application of Eq. 12-19 leads to: Me = [(1.0 x 250) + (2.0 X 210) + (2.3 X 180) +
(2.4 X 170) + (2.4 X 140)]1(250 + 210 + 180 + 170 + 140) = 1.924 cm/d.
|
Figure 12-8 Snowmelt chart for Boise River Basin above Twin Springs, Idaho [10]. |
Example 12-2.
Given the following data, calculate the excess basin water available for runoff by the rational method: basin area 1000 km2; snow line at elevation 3000 m at 14°C mean daily temperature, with subarea below elevation 3000 m equal to 630 km2; melt line at elevation 4000 m at 6°C mean daily temperature, with subarea above elevation 4000 m equal to 150 km2; mean basin precipitation 0.36 cm/d, mean basin losses 0.23 cm/d, and degree-day factor 0.15 cm/(°C-d).
Assume a linear decrease in mean daily temperature with elevation.
The contributing area is 1000 - 630 - 150 = 220 km2.
The mean daily temperature within the contributing area is 10°C.
The snowmelt is: 0.15 × 10 = 1.5 cm/d.
Mean basin melt is: 1.5 × (220/1000) = 0.33 cm/d.
Total basin water is: 0.36 + 0.33 = 0.69 cm/d.
Excess basin water avaiiable for runoff is: 0.69 - 0.23 = 0.46 cm/d.
|
Time Distribution of Runoff
Either unit hydrograph techniques (Section 5.3) or catchment routing methods (Section 10.4) are used in the generation of runoff hydrographs from snow-covered areas.
Conventional unit hydrographs are used for rain-on-snow events.
Special long-tail unit hydrographs may be necessary to synthesize runoff from excess spring snowmelt water [10].
QUESTIONS
|
|
What atmospheric and environmental conditions control snow accumulation?
What is albedo? What is a typical range of albedo for snow-covered surfaces?
What are the principal sources of heat energy involved in melting of the snowpack?
What is the thermal quality of a snowpack? What is a typical value of thermal quality for a ripe snowpack?
What is the solar constant? What is the value of the solar constant?
What is insolation? What is the value of daily insolation amount received at the outer limit of the earth's atmosphere for a 30°N latitude at winter solstice?
What is convective melt? What is condensation melt?
What is rain melt? What is ground melt?
What are the controlling factors in shortwave radiation melt?
What is an index in hydrologic practice?
What is the controlling factor for snowmelt runoff from an open site? What are the most important components in snowmelt runoff from forested areas?
What is a degree-day? What is the degree-day factor?
What is ripening of the snowpack?
How many types of water exist in the snowpack? Explain.
Describe the elevation-band method for determining spring snowmelt runoff hydrographs.
PROBLEMS
|
|
Calculate the daily snowmelt rate for a snowpack of 95% thermal quality subject to a snowmelt heat equivalent of 570 ly/d.
Calculate the shortwave radiation snowmelt for a snow-covered site with insolation under clear sky 590 ly/d, cloud cover coefficient 0.8, forest transmission coefficient 0.9, snow surface albedo 0.7, and thermal quality of the snowpack 97%.
The following mean daily temperatures (in degrees Celsius) were measured in a snowcovered forest site during a certain week: Monday, 10°C; Tuesday, 11°C; Wednesday, °C;Thursday, 13°C; Friday, 12°C; Saturday, 14°C, and Sunday, 11°C. Calculate the melt for a degree-day factor of 0.25 cm/(0°C;-d). Assume a temperature base of O°C.
The following mean monthly temperatures have been recorded in a snow-covered forest site during the spring: April, 44°F; May, 52°F; and June, 60°F. The snowpack water equivalent at the end of March is 36 in. Assuming a degree-day factor of 0.04 in./(0°F-d), determine the potential snowmelt during the 3-month period. Compare this potential snowmelt value with the water equivalent at the end of the snowfall season (assume end of March) to determine whether there is any melt in Mayor June. Assume a temperature base of 32°F.
Compute basin snowmelt using a generalized snowmelt equation for the following data: forested area; wind speed at 50-ft above the snow surface, v = 30 mph; air temperature at a 10-ft height, 65°F; dew point temperature at 10 ft height, 50°F; snow surface temperature, 32°F; and basin factor k = 0.4.
Compute basin snowmelt using a generalized snowmelt equation applicable for rainfall periods for the following data: heavily forested area; temperature of saturated air at a 10-ft height, Ta = 60°F; and rainfall rate Pr = 1.5 in./d.
Given the following area-elevation data and daily rainfall, snowmelt, and losses for a certain basin, use the elevation-band method to compute the excess basin water available for runoff.
Elevation
Band (m)Subarea
(km2)Rainfall
(cm/d)Snowmelt
(cm/d)Losses
(cm/d)2000 - 2500 150 4 0 3 2500 - 3000 100 5 4 2 3000 - 3500 50 6 2 1 Given the following area-elevation data for a certain basin, use the rational method to compute the excess basin water available for runoff. Assume snow line at elevation 2200 m; melt line at elevation 2600 m; mean basin rainfall, 7 cm/d; snowmelt, 3 cm/d; and mean basin losses, 2 cm/d.
Elevation (m) 2000 2200 2400 2600 2800 3000 Cumulative Area (km2) 0 450 630 730 800 840 Given the following area-elevation data for a certain basin, use the rational method to compute the excess basin water available for runoff. Assume snow line at elevation 5000 ft; melt line at elevation 6000 ft; mean basin rainfall, 2 in./d; mean basin losses, 0.5 in./d; degree-day factor 0.075 in./(0°-d); temperature at the index station at elevation 5500 ft, 42°F; and a temperature gradient of -10°F per 500-ft increase in elevation.
Elevation (ft) 4500 5000 5500 6000 6500 Cumulative Area (mi2) 0 500 900 1200 1400 Using Fig. 12-8, determine the mean basin melt rate for the Boise River Basin above Twin Springs, Idaho, for the following conditions: (a) mean air temperature of 55°F and snow line at elevation 5500 ft; and (b) mean air temperature of 65°F and snow line at elevation 7000 ft.
REFERENCES
|
|
Bruce, J. P., and R. H. Clark. (1966). Introduction to Meteorology. London: Pergamon Press.
Clyde, G. D. (1931). "Snow Melting Characteristics," Bulletin No. 231, Utah Agricultural Experiment Station, Aug.
Church, J. E. (1941). "The Melting of Snow," Proceedings. Central Snow Conference, Vol. 1, Dec., pp. 21-32.
Gray, D. M., and D. H. Male. (1981). Handbook of Snow. Toronto: Pergamon Press.
Haurwitz, B. (1948). "Insolation in Relation to Cloud Type," Journal of Meteorology. Vol. 5, No.3, June, pp. 110-113.
Horton, R. E. (1915). "The Melting of Snow," Monthly Weather Review. Vol. 43, No. 12, Dec., pp. 599-605.
Meiman, J. R. (1970). "Snow Accumulation Related to Elevation, Aspect and Forest Canopy," Proceedings. Workshop and Seminar in Snow Hydrology. Ottawa: Queen Printers of Canada, pp. 35-47.
Rhea, J. 0., and L. O. Grant. (1974). "Topographic Influences on Snowfall Patterns in Mountainous Terrain," in Advanced Concepts and Techniques in the Study of Snow and Ice Resources. National Academy of Sciences, Washington, DC.
Spreen, W. C. (1947). "A Determination of the Effect of Topography Upon Precipitation," Transactions. American Geophysical Union. Vol. 28, No.2, April, pp. 285-290.
U.S. Army Corps of Engineers, North Pacific Division. (1956). "Snow Hydrology, Summary Report of the Snow Investigations," Portland, Oregon, June.
U.S. Army Engineer, North Pacific Division. (1986). "Program Description and User Manual for SSARR Model, Streamflow Synthesis and Reservoir Regulation," Portland, Oregon, Draft, April.
Wilson, W. T. (1941). "An Outline of the Thermodynamics of Snowmelt," Transactions. American Geophysical Union, Part I, pp. 182-195.
Gray, D. M., and D. H. Male. (1981). Handbook of Snow. Toronto: Pergamon Press.
National Academy of Sciences. (1974). Advanced Concepts and Techniques in the Study of Snow and Ice Resources. Washington, DC.
U.S. Army Corps of Engineers, North Pacific Division. (1956). "Snow Hydrology, Summary Report of the Snow Investigations," Portland, Oregon, June.
| http://engineeringhydrology.sdsu.edu |
|
150715 |