|
|
| Documents in Portable Document Format (PDF) require Adobe Acrobat Reader 5.0 or higher to view; download Adobe Acrobat Reader. |
|
CUMULATIVE IMPACTS ON WATER RESOURCES
OF LARGE-SCALE ENERGY PROJECTS
IN BOULEVARD AND SURROUNDING COMMUNITIES,
SAN DIEGO COUNTY, CALIFORNIA
Victor M. Ponce
30 April 2013
|
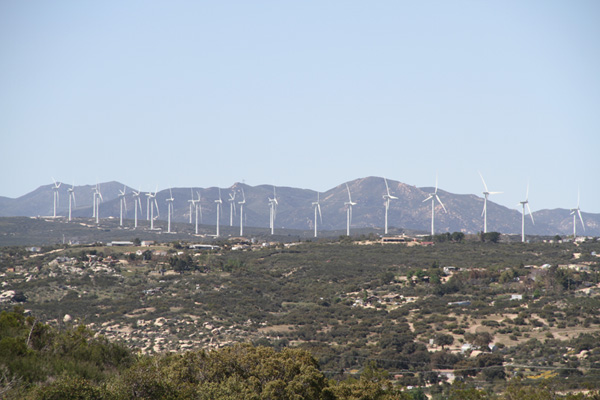
Boulevard and its surrounding communities are
located in southeast San Diego County, California,
at a distance of about 50 miles from the city of San Diego.
These communities and the resources they rely upon are now being threatened by the development of
large-scale energy projects that, if carried to completion,
promise to permanently change their essentially rural character.
The projects consist of wind and solar energy projects, the need for which is ostensibly being based on the State's avowed mandate
for conversion to renewable sources of energy.
The affected communities are fully reliant on groundwater, since there is no economically viable alternative.
Existing groundwater demand is 14% of the recharge,
a value which is nearly double that of the Continental United States average of 8.7%.
With the implementation of the proposed energy projects,
future water demand is likely to increase to 29% of recharge.
Effectively, the future water demand will be more than twice the existing water demand.
One fact remains uncontested: Almost all groundwater is in transit to the neighboring surface water.
Therefore, pumping of groundwater should
be reduced to the minimum amount that can be proven to not have an adverse impact on the neighboring
surface water or related ecological resources (wetland and riparian).
An interdisciplinary approach is needed, one that goes beyond hydrogeology to encompass
surface water, ecohydrology, and socioeconomic aspects.
A major rezoning of a rural area into industrial area necessitates that the additional sources of water be clearly identified at the outset.
As this study shows, in the case of Boulevard and surrounding communities, this has yet to be accomplished.
To remain sustainable, the proposed energy projects must be required to import their water
from authorized sources elsewhere. This will assure that the actual value of groundwater capture-to-recharge percentage remains within reasonable bounds.
|
1. INTRODUCTION
|
|
1.1 Background
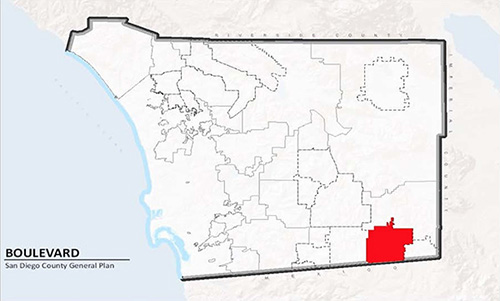
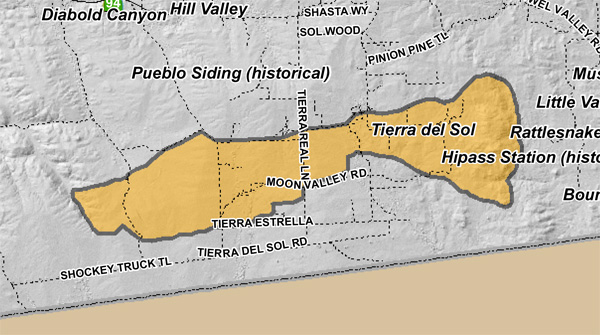
Boulevard and surrounding communities, referred to in this report as the study area, are located in southeast San Diego County, California, at a distance of about 50 miles from the city of San Diego, near the border with Imperial County (Fig. 2). These communities and the resources they rely upon are now being threatened by the development of large-scale energy projects that, if carried to completion, promise to permanently change their essentially rural character. The projects consist of wind and solar energy projects, and related energy infrastructure (transmission lines), the need for which is ostensibly being predicated on the State's avowed mandate for conversion to renewable sources of energy.
Fig. 2 General location of Boulevard Planning Area [Click on image to enlarge]. |
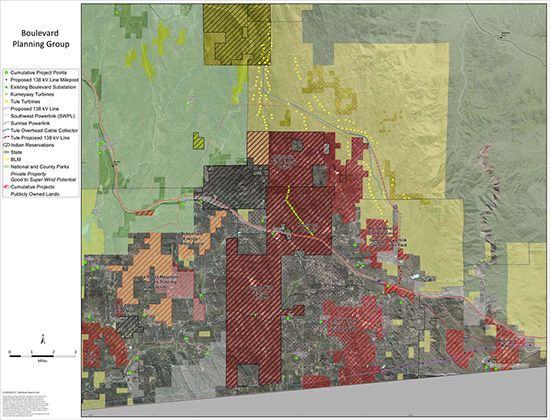
On this basis, the County of San Diego is currently considering amendments to its General Plan Regional Land Use Element and related zoning and regulatory ordinances.1 These amendments will allow wind and solar energy projects as well as related transmission infrastructure projects to be built in Boulevard and surrounding communities (Fig. 3). There is strong local opposition to these amendments, which, if approved, will change the character of the affected communities.
The proposed energy developments appear to run counter to some of the objectives of the San Diego County General Plan Update (County of San Diego 2011a). These objectives are:
Reinforce the individual quality of existing communities.
Ensure that development accounts for the natural hazards of the land.
Maintain environmentally sustainable communities.
Fig. 3 Detail of Boulevard Planning Area [Click on image to enlarge]. |
Moreover, these proposed projects have failed to adequately substantiate the sources of water to be committed for energy development. Intensive development in a desert region such as Boulevard poses significant challenges due to increased water demands, while the supply remains essentially unchanged. Boulevard and surrounding communities are fully reliant on groundwater, since there is no economically viable alternative. The question is: To what extent will the increased amounts of groundwater needed for energy infrastructure development tax the capacity of the regional aquifer to satisfy the needs of all users, old and new?
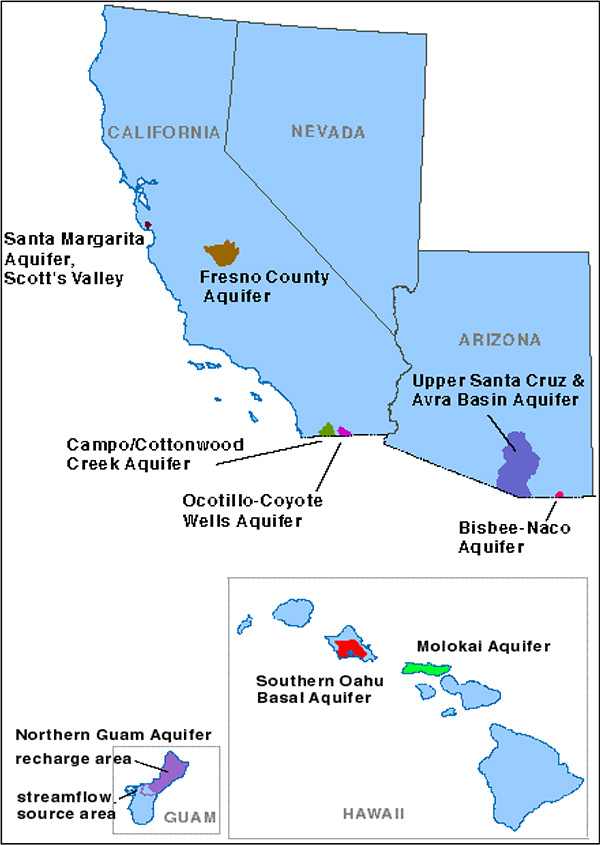
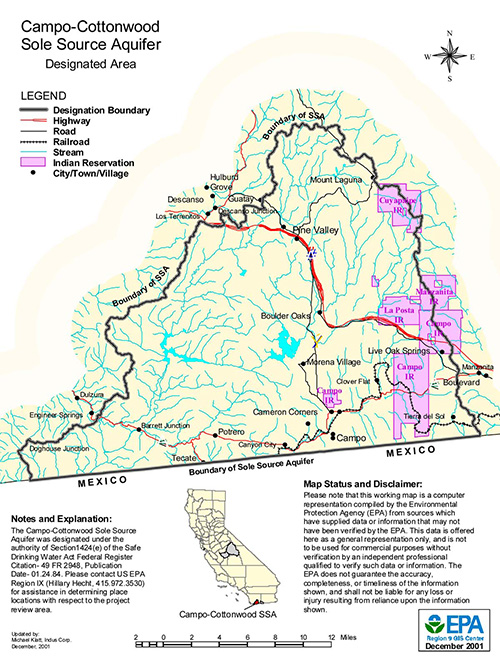
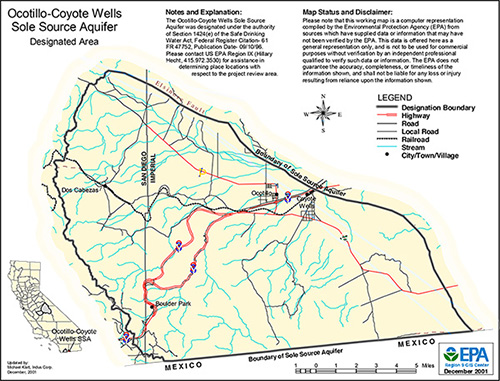
There are two sole source aquifers in the immediate vicinity of the study area (Fig. 4):
Campo-Cottonwood Creek sole source aquifer, in San Diego County, and
Ocotillo-Coyote Wells sole source aquifer, in Imperial County.
An aquifer can be named a sole source aquifer by the Administrator of the Environmental Protection Agency if it supplies 50% or more of the drinking water for an area and there are no reasonably available alternative sources should the aquifer become contaminated.
Fig. 4 Location of Campo-Cottonwood Creek and Ocotillo-Coyote Wells aquifers. |
The western portion of the study area lies within the Campo-Cottonwood Sole Source Aquifer (Fig. 5).2 The eastern portion is located west of the Ocotillo-Coyote Wells Sole Source Aquifer (Fig. 6).3
Fig. 5 Location of Campo-Cottonwood Creek Sole Source Aquifer [Click on image to enlarge]. |
The issue of how much groundwater to pump before the operation becomes unsustainable is something that has no easy answer. The County of San Diego's approach is based on traditional hydrogeology, which argues that a safe yield may be taken as the amount of recharge to a suitable control volume. This approach has been widely discredited in the past 15 years (Bredehoeft 1997).4 It would only make sense if groundwater is a volume; yet, groundwater is not a volume, but a flux.5 Sequestering all the recharge means sequestering all the discharge, effectively drying up all downstream uses and/or users (Sophocleous 1997 [1]).6
Fig. 6 Location of Ocotillo-Coyote Wells Sole Source Aquifer [Click on image to enlarge]. |
Enlightened water resources management now seeks to determine sustainable yield as a suitable fraction of the recharge, to be assessed based on hydrological, ecohydrological, economic, and social factors, rather than solely on the results of pumping tests. An authoritative U.S. Geological Survey report (Alley et al. 1999 [1]) defines groundwater sustainability as the development and use of groundwater in a manner that can be maintained for an indefinite time without causing unacceptable environmental, economic, or social consequences.
The definition of unacceptable is largely subjective, depending on the individual situation. For instance, what may be established as an acceptable rate of groundwater withdrawal with respect to changes in groundwater level may reduce the availability of surface water, locally or regionally, to an unacceptable level. Thus, safe yield is the maximum pumping rate for which the consequences are considered acceptable from an interdisciplinary standpoint (Alley et al. 1999 [2]).
1.2 Scope
This report analyzes the cumulative impacts of the renewable energy projects, namely solar and wind, currently being planned for location in Boulevard and surrounding communities. The report focuses on the issues of groundwater sustainability in light of the additional water demand resulting from the proposed intensive development of this desert region. Up to thirteen (13) energy and related infrastructure projects are currently either existing or planned in the study area (Fig. 7). The cumulative impacts of these projects on the regional water resources are assessed in this report. Recommendations to mitigate the problem of potential water scarcity and associated negative impacts are formulated.
Fig. 7 Location of Boulevard energy projects [Click on image to enlarge]. |
2. PROJECTS
|
|
2.1 List of projects
The number of renewable energy projects (wind, solar, and related substation and transmission infrastructure) that currently exist or are being proposed for the study area are listed in Table 1. The affected communities are Boulevard and surrounding communities. The communities include: (1) Tierra del Sol, (2) Live Oak Springs, (3) McCain Valley, (4) Jewel Valley, (5) Miller Valley, (6) Tierra Heights, (7) Calexico Lodge, (8) Bankhead Springs, and (9) Campo Indian reservation.
| |||||||||||||||||||||||||||||||||||||||||||||||||||||||||||||||||||||||||||||||||||||||||||||||||
2.2 Kumeyaay Wind
Kumeyaay Wind Farm is located near the community of Boulevard, about 50 miles east of the city of San Diego. The project straddles the Tecate Divide, north of Interstate Highway 8 (I-8), on land leased by Infigen Energy from the Campo Band of Mission Indians of the Kumeyaay Nation.
The project consists of 25 wind turbines, each capable of generating 2 MW, for a total capacity of 50 MW (Fig. 8). The wind farm commenced operations in December 2005. The water used during construction for road building, turbine construction and dust suppression is unknown.
|

2.3 Tule Wind
The Tule Wind Farm project consists of up to 134 wind turbines and associated roads, transmission lines, and support facilities. It is proposed to be developed on 15,350 acres in eastern San Diego County, enclosed in blue in Fig. 9. The project area is located approximately 1 mile north of Interstate 8 (I-8), generally between La Posta Truck Trail on the west and McCain Valley Road on the east.
Fig. 9 Location of Tule Wind Project [Click on image to enlarge]. |
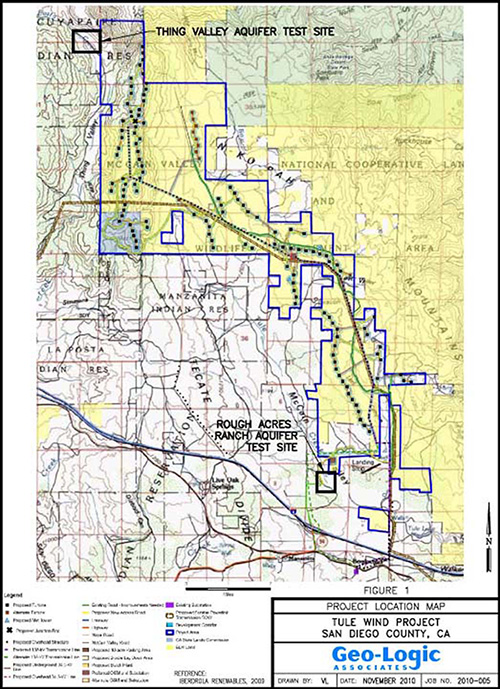
Water for Tule Wind will come from two sites:
- Thing Valley, on the northern end, and
- Rough Acres Ranch, in the McCain Valley, on the southern end.
Water demand will vary as follows:
- 120,000 gpd during road building only,
- 250,000 gpd during road building, turbine construction, and dust suppression,
- 130,000 gpd during turbine construction only, and
- 100,000 gpd for dust suppression only.
The estimated duration for project construction is approximately one (1) year. The total estimated volume of extracted groundwater is 65-125 ac-ft (Geo-Logic Associates 2010). This amounts to 21-41 million gallons. Thus, the [maximum] amount of groundwater demand for the Tule Wind Project is 41 million gallons.
2.4 Jewel Valley Wind
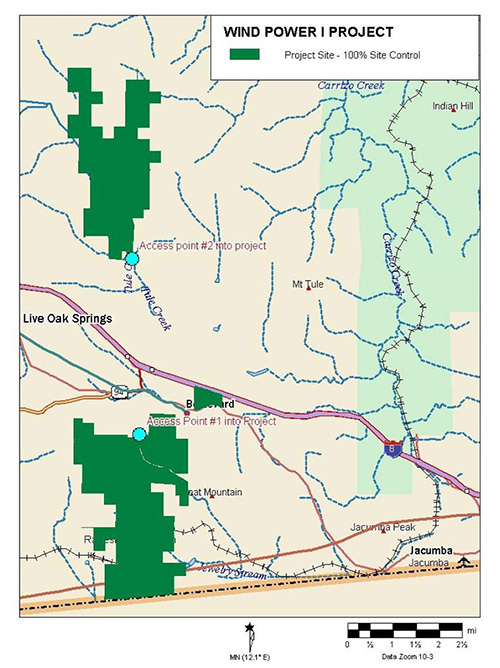
The Jewel Valley Wind Project consists of 158 MW of wind energy generation and up to 10 MW of solar power generation, to be developed on private land north and south of Interstate 8 (I-8), near Boulevard. The location is highlighted in green in Fig. 10.
The total number of turbines proposed for Jewel Valley Wind is 68. The northern portion of the project includes up to 66 MW of wind energy generation and utilizes up to 28 wind turbines of 2.3 MW to 3.0 MW each. It may also include 10 MW of solar power generation. The southern portion of the project includes up to 92 MW of wind energy generation and utilizes up to 40 wind turbines of 2.3 MW to 3.0 MW each. The towers of the proposed turbines would be approximately 260 ft (79 m) tall. The height from ground to tip of a fully extended blade would be approximately 450 ft (137 m) (U.S. Department of Energy 2012).
Fig. 10 Location of Jewel Valley Wind Project [Click on image to enlarge]. |
There is no available information regarding water demand for the Jewel valley project, to be used
for road building, turbine construction, and dust
suppression. It is assumed here that it would be similar to that of other wind-energy projects in the area.
Based on the water demand for Tule Wind, a groundwater demand for the Jewel Valley Wind project is estimated as
follows:
2.5 Shu'luuk Wind
The Shu'luuk Wind Project is being proposed by Inverenergy Wind, LLC (Invenergy), in cooperation with the Campo Band of Mission Indians of the Kumeyaay Nation. The U.S. Bureau of Indian Affairs is the lead agency in the EIS/Invenergy lease review process. The project is located on the Campo Indian Reservation in southeast San Diego County. It consists of the construction and operation of a commercial wind energy generation facility (Fig. 11).
Fig. 11 Location of Shu'luuk Wind Project, within the Campo Indian reservation |
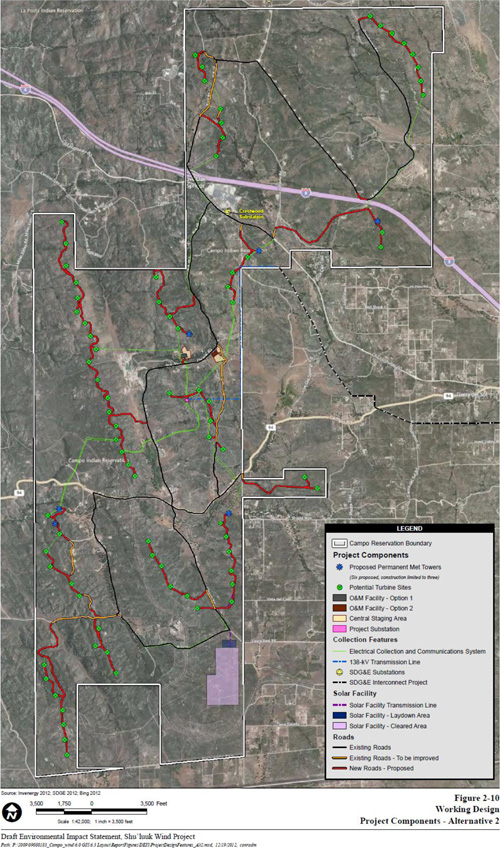
The proposed project involves the construction, installation and operation of 54 to 85 wind turbines to generate electricity, the actual number to depend on the alternative selected. Ancillary physical features of the project include: (1) a substation, (2) up to 5 miles of new transmission lines, (3) aproximately 25 miles of new access roads, and (4) an O&M building.
Three alternatives have been identified:
- 250 MW of wind energy
- 160 MW of wind energy plus 40 MW of solar energy (300 acres)
- 160 MW of wind energy.
The groundwater demand for Alternative 1, the most water demanding of the three alternatives, has been estimated as 107 ac-ft (Ponce 2013 [1]). This demand is equivalent to 35 million gallons.
2.6 Shu'luuk Wind Gen-Tie
The Shu'luuk Wind Gen-Tie project will connect the Shu'luuk Wind project to regional SDG&E energy infrastructure facilities. It is located south of Interstate 8 (I-8) and Old Highway 80, cutting across just south of Live Oak Springs, and neighboring Boulevard and surrounding communities in southeast San Diego County, California.
The project will meet the following objectives:
Replace the existing 69 kV wood pole structures with steel poles that include 138 kV class insulators.
Provide the interconnection facilities for the Shu'luuk Wind project.
Maximize the use of existing utility right-of-way and access roads.
The water demand for the Gen-Tie project has been estimated at 2.3 million gallons. The project intends to use imported surface water to satisfy its needs (SDG&E 2012).
2.7 Energia Sierra Juarez Wind Gen-Tie
The Energia Sierra Juarez U.S. Gen-Tie Project is proposed by Energia Sierra Juarez U.S. Transmission, LLC. This project will connect wind energy produced in Sierra Juarez, Baja California, to the proposed SDG&E ECO Substation (Section 2.14).
Construction of the Energia Sierra Juarez Gen-Tie Project will require approximately 0.78 million gallons of groundwater during the six-month construction period (SDG&E 2011). The project plans to obtain this water from an off-site groundwater well owned by the Jacumba Community Services District (Fig. 12). This well is located on the western edge of the community of Jacumba, approximately 4 miles west of the project site.
|
2.8 Soitec Rugged Solar
The Soitec Rugged Solar Project is one of four (4) projects proposed by Soitec Solar Development in Boulevard and surrounding communities, covering a total of 1,473 acres (Soitec 2013) [The other three projects are described in the following sections]. Soitec Rugged Solar is located north of Interstate 8 (I-8) in the vicinity of Ribbonwood Road and McCain Valley Road (Fig. 13). The proposed project would produce 80 MW of electricity by means of 3,588 concentrating photovoltaic (CPV) systems utilizing dual-axis tracking. The project will use a 69-kV overhead gen-tie line connection from the on-site substation to SDG&E's proposed Boulevard Substation.
Soitec Rugged will rely on groundwater for the construction and operational phases. The project will require 24 million gallons of water for the 18-month construction period. This amounts to an average of 16 million gallons per year. During peak periods of construction, 120 workers per day would be working on the project site (County of San Diego 2012a).
Fig. 13 Location of Soitec Solar Projects [Click on image to enlarge]. |
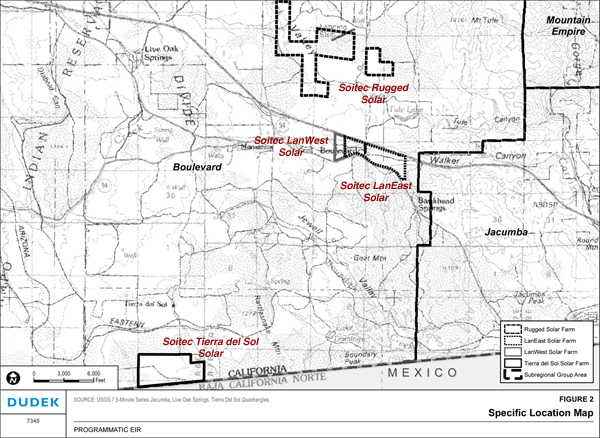
2.9 Soitec Tierra del Sol Solar
The Soitec Tierra del Sol Solar Project is located south of Interstate 8 (I-8), within private lands in eastern San Diego County (Fig. 14). The site is situated south of Tierra del Sol Road and immediately north of the U.S./Mexico border. Soitec Tierra del Sol would produce 60 MW of electricity with 2,538 concentrating photovoltaic (CPV) systems utilizing dual-axis tracking. It will use a 138-kV overhead gen-tie line connection from the on-site substation to SDG&E's proposed Boulevard Substation.
The project will be constructed in two phases for a total period of 12 months, utilizing 20 million gallons of water. During peak periods of construction, 146 workers per day would be working on the site (County of San Diego 2012a).
Fig. 14 Site of Soitec Tierra del Sol Solar. |
2.10 Soitec LanEast Solar
The Soitec LanEast Solar Project is bordered by Interstate 8 (I-8) to the north and Old Highway 80 to the south, with McCain Valley Road bisecting the project site (Fig. 13). The proposed project would produce 22 MW of electricity using 900 concentrating photovoltaic (CPV) trackers. The project requires an overhead gen-tie line to connect the on-site substation to SDG&E's proposed Boulevard Substation located approximately 1,000 ft southwest of the project boundary (County of San Diego 2012a). The site of Soitec LanEast Solar is shown in Fig. 15.
An estimate of the water needs of this project is not available at this time.
An approximation based on a comparison with the water needs of Soitec Rugged Solar is:
Fig. 15 Site of Soitec LanEast Solar. |
2.11 Soitec LanWest Solar
The Soitec LanWest Solar is bordered by Interstate 8 (I-8) to the north and Historic Route 80 (Old Highway 80) to the south, and it is located immediately to the west of Soitec LanEast (Fig. 13). The proposed project would produce 6.5 MW of electricity using 264 concentrating photovoltaic (CPV) trackers. The project requires a dedicated 12.5-kV distribution line to deliver the power generated to SDG&E's proposed Boulevard Substation (County of San Diego 2012a). The site of Soitec LanWest Solar is shown in Fig. 16.
An estimate of the water needs of this project is not available at this time.
An approximation based on a comparison with the water needs of Soitec Rugged Solar is:
Fig. 16 Site of Soitec LanWest Solar. |
2.12 Sol Orchard Boulevard
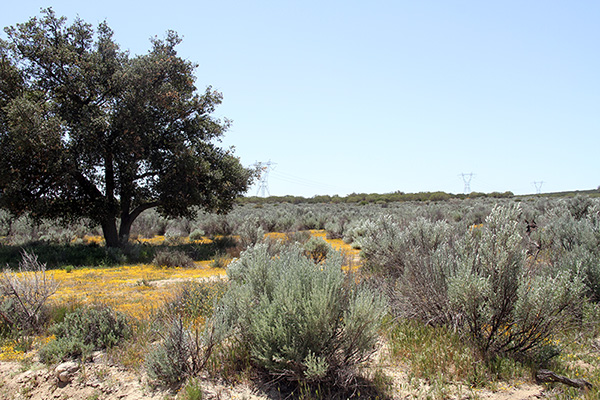
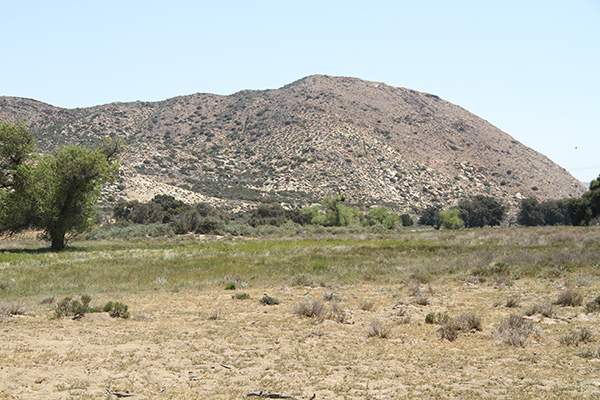
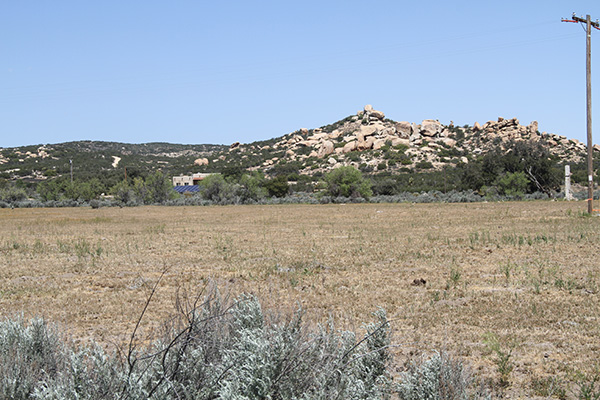
The Sol Orchard Boulevard Project is located south of Historic Route 80 and east of Ribbonwood Road (Fig. 17). The proposed project includes 21,736 axis-tracking solar panels capable of producing 5 MW of energy. The site of Sol Orchard Boulevard Solar is shown in Fig. 18.
The project will require a total of 19.8 ac-ft of water, which is equivalent to 6.45 million gallons (County of San Diego 2012b). While the project does not intend to use on-site water, the only available water is local groundwater.
Fig. 17 Location of Sol Orchard Boulevard Solar [Click on image to enlarge]. |
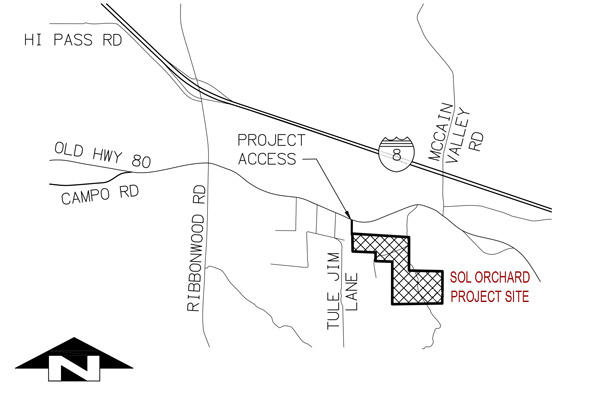
Fig. 18 Site of Sol Orchard Boulevard Solar. |
2.13 Eco and Boulevard Substations
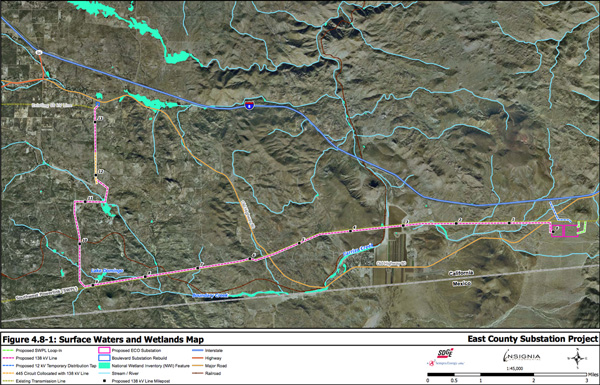
The proposed project area is within the Anza Borrego hydrologic unit and the Jacumba hydrologic area of the Colorado River Basin. The Boulevard Substation is located within the McCain hydrologic subarea, while the proposed ECO Substation is located within the Jacumba hydrologic subarea. The proposed 138 kilovolt (kV) transmission line will be located in both subareas (Fig. 19) (SDG&E 2009).
Fig. 19 Transmission line between the Boulevard and Eco Substations [Click on image to enlarge]. |
The Boulevard and Eco Substations Project includes the following components (SDG&E 2010):
500/230/138 kilovolt (kV) ECO Substation
Southwest Powerlink (SWPL) loop-in, a short loop-in of the existing SWPL transmission line to the proposed ECO Substation
138 kV transmission line, approximately 13.3 miles in length, running between the proposed ECO Substation and the rebuilt Boulevard Substation
Boulevard Substation rebuild.
Construction of the ECO Substation Project will take approximately 2 years and will require approximately 30 million gallons (SDG&E 2009). This is equivalent to 15 million gallons per year. The Jacumba Community Services District bulk sales water well (Fig. 12) will be partly used to satisfy the demand. This well is currently limited to 40,000 gallons per day, which amounts to 14.6 million gallons per year, to be allocated to many users on a first-come first-served basis.7 It is estimated that half of the available water, amounting to 14.6 / 2 = 7.3 million gallons, will be purchased by the ECO Substation Project. The remaining demand, equivalent to 15 - 7.3 = 7.7 million gallons, would have to be satisfied from other sources, most likely, within the Boulevard Planning Area.
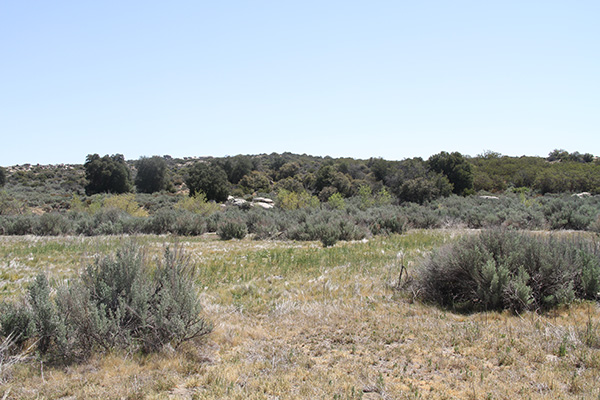
As shown in Fig. 20, site clearance for the ECO Substation has been completed as of April 2013.
Fig. 20 Site clearance for construction of the Eco Substation. |
2.14 Rough Acres Camp and Rock Crushing
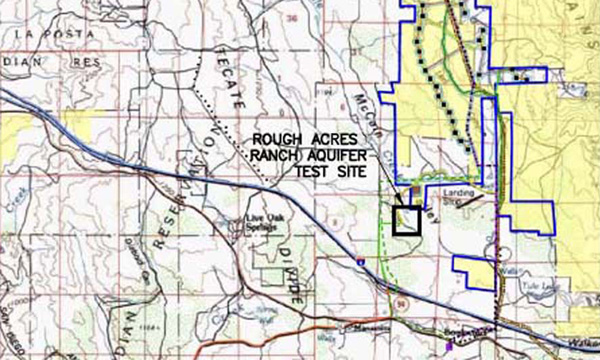
The Rough Acres Ranch Campground is being proposed in the Boulevard area, with access via Ribbonwood Road and McCain Valley Road. A vicinity map is shown in Fig. 21. The Major Use Permit is for a conference or corporate retreat center, including skeet shooting range, two campgrounds with 168 sites, 200-seat amphitheater, three (3) private residences with barns, agricultural barns (20,000 chickens), and rock crushing (County of San Diego 2012c). The estimated water demand is 8.8 million gallons per year.8
Fig. 21 Vicinity of Rough Acres Ranch Campground [Click on image to enlarge]. |
3. WATER DEMANDS
|
|
3.1 Existing water demand
There are several distinct water users in the study area:
-
The population of Boulevard and its surrounding communities,
-
Golden Acorn Casino, in the Campo Indian reservation,
-
Boulevard Border Patrol Station, and
-
McCain Valley Conservation Camp.
The totality of the existing water demand is satisfied with groundwater.
The population of Boulevard and surrounding communities is estimated as 1,500
people.9
Assuming the typical number of four (4) persons per household, the number of households in the study area
is estimated as follows:
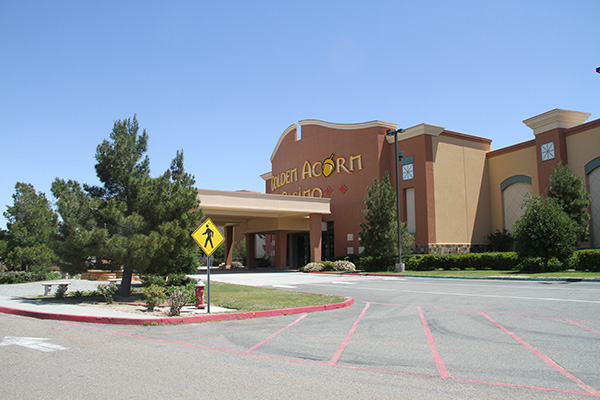
The Golden Acorn Casino has an area of 40,000 square feet and it features 750 slot machines, blackjack tables, video poker games, video keno games, a gas station, a restaurant, a deli, and a full-service cocktail lounge. The water demand for the Golden Acorn Casino has been estimated as 150,000 gallons per day (Fig. 22). This is based on an estimate of the volume of treated water ranging from 0.15 to 0.30 million gallons per day (AECOM 2012). This water demand is equivalent to 168 ac-ft/yr.
Fig. 22 The Golden Acorn Casino. |
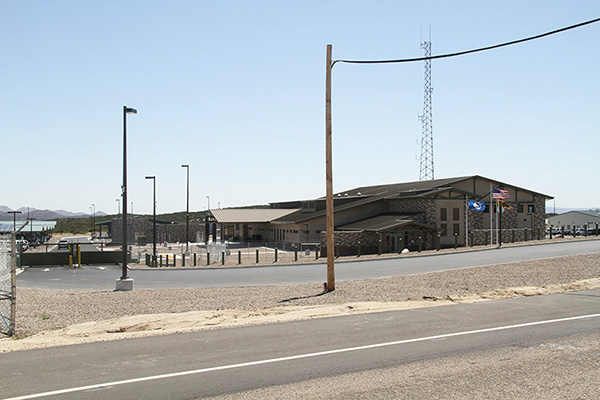
The recently completed Boulevard Border Patrol Station sits on a 31-acre rural site just off Interstate 8 (I-8) in Boulevard, California. The station includes a main station building for 250 agents and support staff, a vehicle and maintenance facility center, an equestrian compound with a stable and an arena, a 160-ft communications tower, a vehicle wash rack with recirculating water system, a fueling station, a 10-lane 50-m indoor firing range, a back generator, an emergency helipad, access roads, parking, fencing, security lights, and other site support (Fig. 23).
Water for the new station is provided by new wells drilled as part of the project. Based on an average usage of 250 gallons per person per day, the estimated water usage for 250 persons is 62,500 gallons per day, which is equivalent to 70 ac-ft/yr.
Fig. 23 New Border Patrol Station, Boulevard, California. |
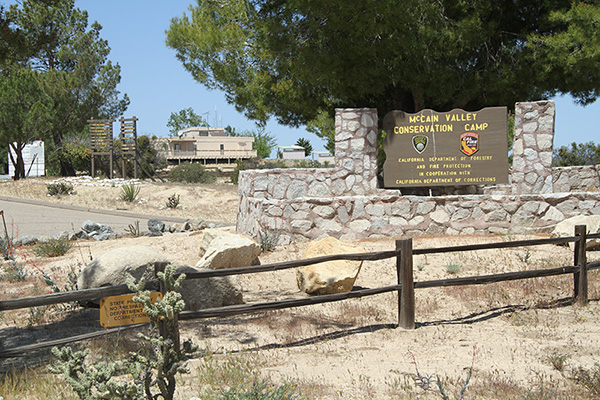
The McCain Valley Conservation Camp was established in 1986. The camp engages in all forms of risk disaster mitigation, pre-fire fuel management, the development and maintenance of fire defense improvements and facilities, and the performance of conservation-related projects for local, state, and federal agencies (Fig. 24). The program provides convicted felons with the opportunity to give something back to California citizens while paying their debt to society.
The total staff from the California Department of Corrections and Rehabilitation is 9. The total staffing from CAL-FIRE/LAC is 17. The total number of inmates is 110. The total number of camp inhabitants is 136. Based on an average usage of 250 gallons per person per day, the estimated water usage for 136 persons is 34,000 gallons per day, which is equivalent to 38 ac-ft/yr.
Fig. 24 The McCain Valley Conservation Camp.
Table 2 shows the existing water demand for the study area. The total water demand is 463.5 ac-ft.
3.2 Cumulative water demand of energy projects The cumulative water demand of the energy projects planned in Boulevard and surrounding communities is described in Section 2. The specific values per project are listed in Table 3. The cumulative water demand is 166.04 million gallons, which is equivalent to 509.6 ac-ft. Generally, this amounts applies for the first year, or the year of construction. Depending on project needs, amounts for subsequent years are likely to be smaller.
The future water demand is the sum of the existing demand
plus the additional demand to be realized by the energy projects:
4. WATER RESOURCES
4.1 Water supply In general, the water resources of a community or group of communities are derived from both surface water and groundwater. For a specific case, the percentage of surface water use as compared to groundwater use is likely to vary widely. Particularly for the case of Boulevard and surrounding communities, the percentage of surface water use [in the form of surface runoff] is negligible. Given the different nature of surface water and groundwater, an analysis of the availability of water in a given area or region must consider the following facts:
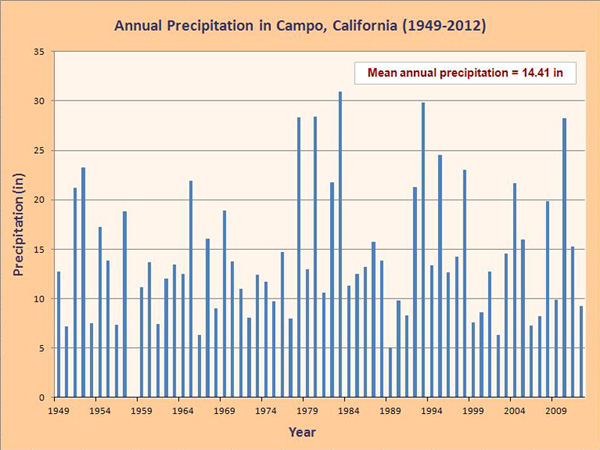
Societies that rely primarily on surface water tend to be sustainable from the water resources standpoint, while societies that place excessive reliance on groundwater are generally not sustainable. Sustainability is an established principle, which all societies must strive for. Lack of sustainability is to be avoided at all costs. In the case of Boulevard and surrounding communities, the use of surface water is negligible, while the use of groundwater is well established by way of practice. Groundwater is replenished from precipitation. The following section describes surface water in Boulevard and surrounding communities, including precipitation, runoff, and groundwater replenishment. 4.2 Surface water Boulevard and surrounding communities are located in southeast San Diego County, California (Fig. 2). The Campo weather station, located immediately west of the study area (Fig. 3), has a long precipitation record, spanning the 64-year period from 1949 to 2012. The calculated mean annual precipitation at the Campo gage is 14.41 in, or 366 mm (Fig. 25). The climatic spectrum is classified as shown in Table 5 (Ponce et al. 2000). According to this table, the study area is classified as arid. 10
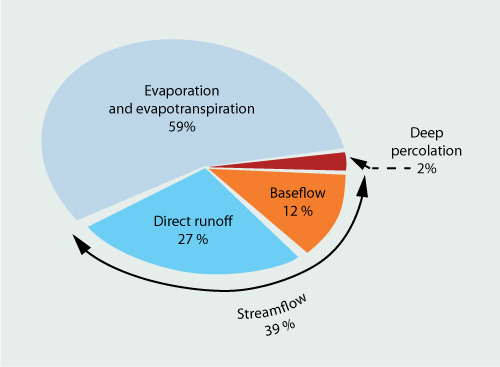
An arid climate typically has little surface water and, consequently, little runoff. The runoff coefficient is usually around 10-15% of precipitation. For comparison, in the middle of the climatic spectrum, at 800 mm (31.5 in) of mean annual precipitation, about 39% of precipitation is converted into streamflow (runoff) (Fig. 26) (World Water Balance 1978; L'vovich 1979; Ponce 2012b). In the study area, at 366 mm (14.41 in) of mean annual precipitation, runoff is seasonal and almost none of it is stored for economic use.
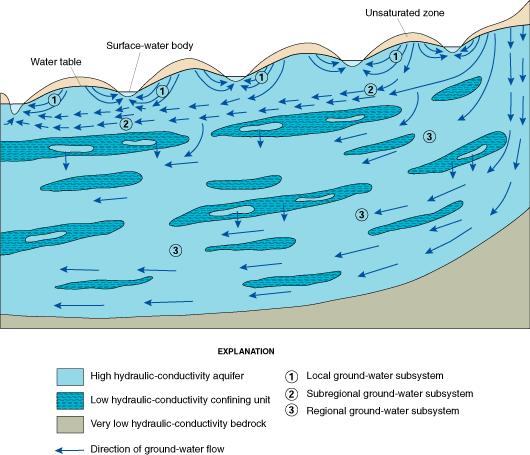
The lack of surface water has forced Boulevard and surrounding communities to rely of groundwater almost exclusively for their water needs. The study area straddles the Campo-Cottonwood aquifer on its eastern boundary (Fig. 5). This aquifer is part of the Tijuana river watershed, which spans both the United States and neighboring Mexico to the south. In 1993, the Environmental Protection Agency (EPA) designated the Campo-Cottonwood aquifer as sole source.2 This federal designation protects the groundwater resources, to assure its preservation and sustainability. 4.3 Groundwater Groundwater is almost always in constant movement, driven by local or regional hydraulic gradients (Fig. 27). The source of all groundwater is percolation from surface water originating in precipitation. The fate of groundwater is either:
Globally, 98% of groundwater appears as baseflow somewhere downstream, while only 2% flows directly into the nearest ocean (World Water Balance 1978; L'vovich 1979).
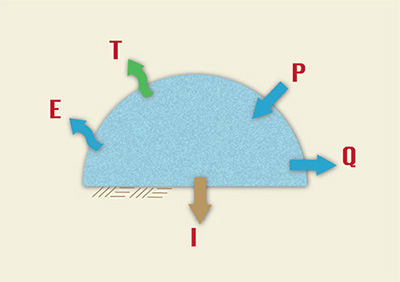
The recharge to groundwater is typically expressed as a percentage of precipitation. Hydrologic data shows that recharge to groundwater varies proportionally with mean annual precipitation. Semiarid and arid regions have proportionally less recharge to groundwater than subhumid and humid regions. In theory, the recharge to groundwater can be evaluated by performing a water balance, where infiltration (I) is calculated by subtracting evaporation (E), evapotranspiration (T) and runoff (Q) from precipitation (P) (Fig. 28).
In practice, however, the natural prototype or system does not lend itself readily to description. While a fraction of the infiltration goes on to constitute recharge, another fraction returns to the atmosphere as the evaporation and evapotranspiration of wetlands and riparian ecosystems. In general, the soil system is heterogenous, anisotropic, and subject to spatial and temporal variations in soil/air/water complex characteristics. Therefore, it is almost impossible to discern with any degree of certainty what fraction of the infiltration actually made it into recharge, and what fraction returned to the atmosphere as evaporation/evapotranspiration. Over the years, classical hydrology and hydrogeology have seemed unable to resolve this dichotomy. The situation has been resolved by L'vovich, who developed an alternate formulation of the water balance using the concept of catchment wetting (L'vovich 1979, Ponce 1995a [1]; Ponce 1995b; Ponce 2013). Catchment wetting is defined as the fraction of precipitation not contributing to direct surface runoff. L'vovich's approach to the water balance consists of the following steps:
A comparison of water balance formulations using classical hydrology and L'vovich's catchment wetting approach is shown in Table 6.
4.4 Groundwater recharge Barring a calculation of groundwater recharge using L'vovich's methodology, the only recourse appears to be to evaluate groundwater recharge using a synthetic approach, on the basis of a host of data and analyses reported in the literature, keeping in mind that recharge varies proportionally to precipitation. On the dry side of the climatic spectrum, where precipitation is near zero, the recharge percentage is also close to zero (0%). This is the case of superarid regions, with mean annual precipitation less than 100 mm. Conversely, on the wet side of the climatic spectrum, with precipitation greater than 6,400 mm, recharge is a very large fraction of precipitation, often exceeding 40%. This is the case of superhumid regions, as shown in Table 5. In the middle of the climatic spectrum, with mean annual precipitation equal to 800 mm, recharge is estimated to be around 20% (Ponce 2012b). The average global values notwithstanding, Scanlon et al. (2006) have performed a global synthesis of groundwater recharge in semiarid and arid regions, using approximately 140 study areas, including the U.S. Southwest. They report values of recharge varying between 0.1% and 5.0% of mean annual precipitation. A value of groundwater recharge for the Boulevard and surrounding communities equal to 5% of mean annual precipitation is considered to be reasonable, given that mean annual precipitation is equal to 366 mm or 14.41 in, corresponding to an arid climate (Fig. 22).
Thus, average annual groundwater recharge is: (5/100) × 366 = 18.3 mm.
This is equivalent to:
5. GROUNDWATER SUSTAINABILITY
5.1 Framework In the case of Boulevard and surrounding communities, which rely exclusively on groundwater, the question is: How much groundwater can be pumped from the regional aquifer and still remain sustainable? Or rather, what is the sustainable yield of groundwater in the study area? It has now been generally accepted that sustainable yield is a moving target, subject to adaptive management (Maimone 2004). It cannot be taken as equal to the groundwater recharge, because this would end up sequestering all the discharge (Sophocleous 1997 [2]). Since sustainable yield is not related to the recharge, it follows that sustainable yield must be related to the discharge, that is, the percentage of discharge that must be reserved for hydrologic (baseflow) and ecohydrologic (wetlands and riparian ecosystems) uses. In other words: What percentage of the discharge can society afford to capture through well pumping for new development and still satisfy other uses or users? The answer is seen to depend more on hydrologic, ecohydrologic, and socioeconomic factors than on hydrogeology. Thus, studies of groundwater potential that are strictly based on hydrogeology, that is, how much to pump from a well? are bound to be incomplete. Despite a history of more than one-hundred years of groundwater development in the United States, sustainable yield is a relatively new concept. It follows from the concept of sustainable development, which emerged in the 1980s. Sustainable development is that which meets the needs of the present without compromising the ability of future generations to meet their own needs (World Commission on Environment and Development, 1987). Sustainability refers to renewable natural resources; therefore, sustainability implies renewability. Groundwater is neither completely renewable nor completely nonrenewable; therefore, the question of how much groundwater pumping is sustainable is appropriate. In principle, sustainable yield is that which is in agreement with sustainable development. This definition is clear; however, its practical application requires the understanding of complex interdisciplinary relationships. Alley et al. (1999) [3] defined groundwater sustainability as the development and use of groundwater in a manner that can be maintained for an indefinite time without causing unacceptable environmental, economic, or social consequences. Loucks (2000) observed that the assessment of groundwater sustainability must involve professionals from various disciplines. Sustainability studies require a balance of the entire hydrological system, not just of the aquifer. Sustainability implies a basic change in focus from groundwater as an exploitable human resource (the "basin yield" view) to groundwater as a vital part of the complex interrelated processes governing ecosystem health and flow system stability (National Research Council, 2000). Maimone (2004) reasoned that if sustainable yield must be all-inclusive, the idea that there exists a single, correct number representing sustainable yield must be repealed. Instead, he proposed a working definition based on the following components:
Seward et al. (2006) found serious problems with the simplistic assumption that sustainable yield should equal recharge. In many cases, sustainable yield will be considerably less than average annual recharge. Natural recharge does not determine sustainable yield; rather, the latter is determined by the amount of capture that it is permissible to abstract without causing undesirable or unacceptable consequences. 5.2 Area of influence All groundwaters are connected; therefore, ever increasing amounts of capture are likely to draw groundwater volumes from an ever increasing area. This fact has been thoroughly documented; see, for instance, the case study of Paradise Valley, Nevada, by Prudic and Herman (1996). Prudic and Herman (1996) showed the evolving nature of capture with long-term groundwater development. Using the aquifer of Paradise Valley, in Humboldt County, Nevada, as an example, they found that pumping 48% of the recharge for 300 years produced:
Table 7 shows a summary of Prudic and Herman's findings.
This case study clearly shows that, in general, the control volume in groundwater flow is not limited,
and that increasing capture is likely to result in an expansion of contributing areas and associated volumes.
Thus, the fallacy of using surface drainage area(s) as control volume for an estimate
of sustainable yield.
The average annual groundwater recharge in the study area, or recharge depth, is: R = 0.06 ft (Section 4.4).
To determine sustainable yield, the first step is to determine the area of influence (A) and, consequently, the recharge volume (V).
Recharge volume is equal to the recharge depth times the area of influence: The selection of the area of influence is an elusive task (Bredehoft 1997). As a first approximation, the Boulevard Planning Area is taken as the cumulative reference area on which to base the computations of sustainable yield. The Boulevard Planning Area is 55,350 acres (Fig. 3) (County of San Diego, 2011b). 5.3 Sustainable yield To determine sustainable yield in the study area, an appropriate value of capture-to-recharge must be selected. A rational approach is to start with a small percentage of capture-to-recharge and develop data and experience to justify an increase at a later date. In the absence of comprehensive interdisciplinary studies, values of capture-to-recharge between 10% and 30% are considered appropriate (Sophocleous 1997; Ponce 2007; Ponce, 2012b). Table 8 shows the calculated sustainable yield in the study area, for postulated values of capture-to-recharge varying between 10% and 30%.
6. ANALYSIS
6.1 Capture-to-recharge For the sake of comparison, it is instructive to examine the range of practical values of capture-to-recharge percentage. Values of capture-to-recharge vary from 0% in undeveloped basins, to about 10% in average basins, to more than 100% in highly developed basins.11 For instance, an average value of capture-to-recharge in the Continental United States has been reported as 8.7% (Alley et al. 1999 [4]; Ponce 2012b). Moreover, some highly developed basins may have capture-to-recharge percentages exceeding 100% (Table 9) (Ponce 2012b). This fact confirms that the control volume in hydrogeology is not limited, with increasing amounts of capture compromising increasing surface areas and associated volumes.
6.2 Summary Table 10 shows calculated capture-to-recharge percentages for the Boulevard Planning Area, for both existing conditions and future conditions, after implementation of the proposed energy projects detailed in Section 2.
Thus, the implementation of the energy projects in Boulevard and surrounding communities will increase the capture-to-recharge percentage from the current low value of 13.96% to the relatively high value of 29.31%. Note that the current value of 13.96% is nearly double the Continental United States average value of 8.7% (Table 9). 7. ADDITIONAL IMPACTS
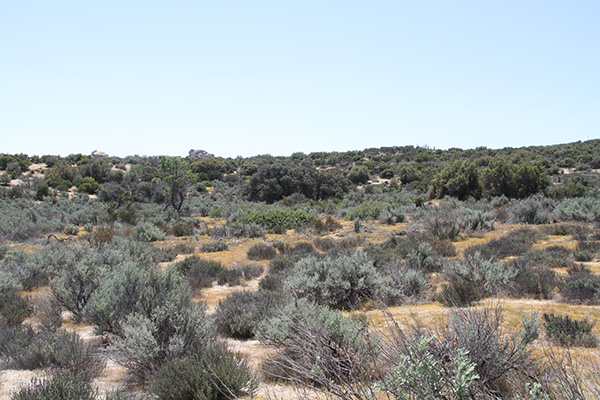
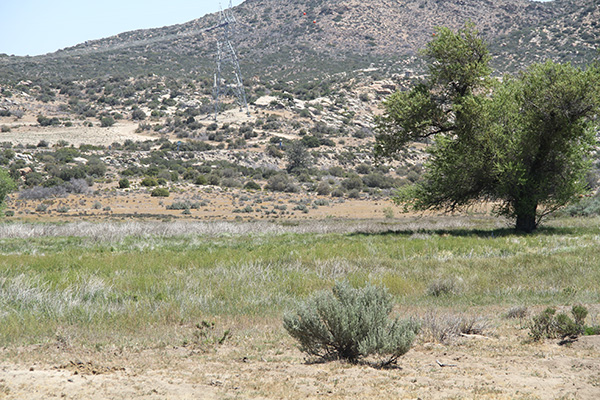
7.1 Wetlands The proposed energy projects may negatively impact wetlands and riparian areas in the vicinity of the project sites. One such case is that of Soitec LanEast Solar, which is located directly on top of a seasonal wetland (Fig. 29). In addition, Soitec LanEast Solar will likely impact natural flows that feed into Walker Canyon, a protected area.12
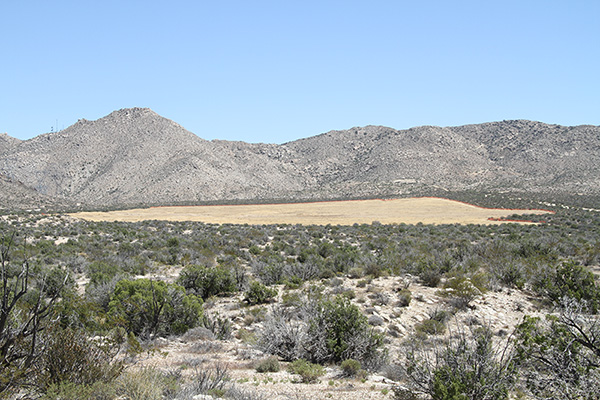
Another case is that of Soitec Rugged Solar, located in the McCain valley. Pumping in the McCain valley may cause drawdown of the aquifer, affecting Tule Creek and its riparian communities (Fig. 30).
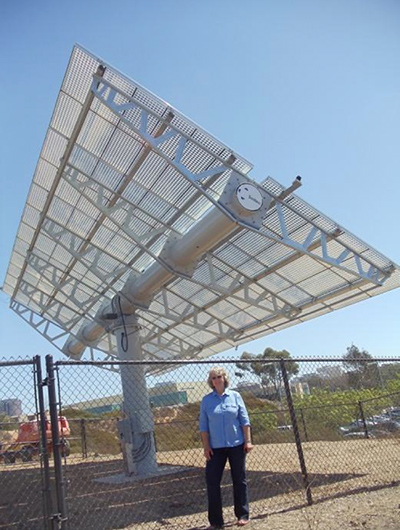
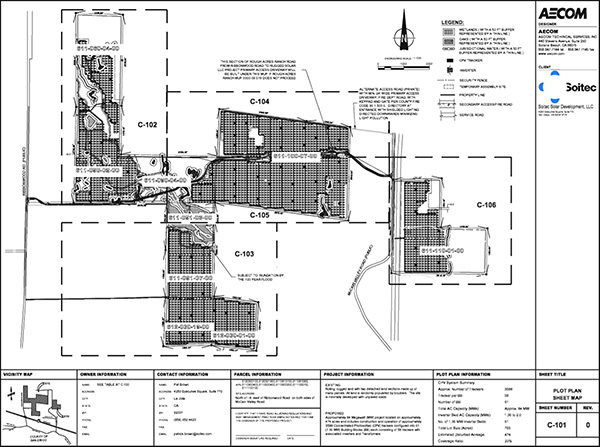
7.2 Floods The Soitec Rugged Solar project is bisected by the Tule Creek floodplain, located on the McCain valley (Fig. 15). The project will install 3,588 CPV (concentrating photovoltaic) systems to generate 80 MW of electricity (Fig. 31). According to the plot plan, a number of the systems will be located in close proximity to the stream (Fig. 32). This poses a recurrent risk of flooding.13
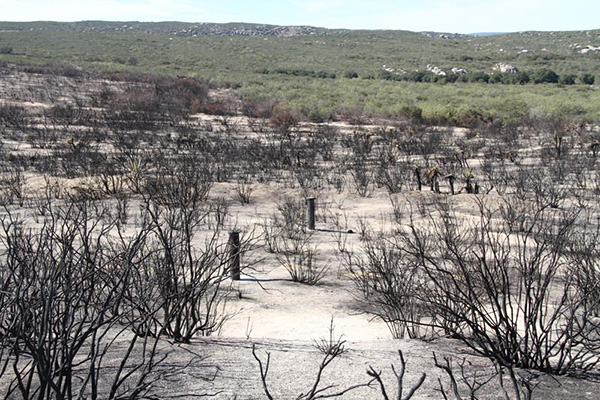
7.3 Wildfires
The Boulevard Planning Area is subject to the risk of wildfires. The last major wildfire, the
The area covered by the fire comprised portions of the Shu'luuk Wind Project (Fig. 34), the transmission line route for Tierra del Sol Solar, and the western portion of the Jewel Valley Wind project area.
7.4 Hazardous wastes The energy projects will utilize various types of oils and lubricants. Experience with wind energy facilities indicates that each wind turbine can hold up to 200 gallons of mineral oil coolant, each turbine transformer up to 500 gallons, and a wind substation up to 12,000 gallons (U.S. Bureau of Land Management 2012). There is a risk that spillage of hazardous materials may reach the underlying aquifer and negatively impact its water quality. The Campo-Cottonwood Sole Source Aquifer was designated as such by the Environmental Protection Agency, for the purpose of preserving it for usage by the local population. Other than groundwater, there is no other economically viable alternative in the Boulevard Planning Area. Thus, spillage of hazardous materials will have an adverse impact on public health. 7.5 Climate change Several issues regarding climate change need appraisal before a decision is made to proceed with the energy projects. Some of these issues are listed below:
8. CONCLUSIONS
8.1 Conclusions The following conclusions are formulated in this study:
Most groundwater wells in the study area are drilled and maintained by local homeowners. Thus, the cost of mitigating possible well interference will come at their own expense, even though the source of the problem may be an industrial project located in the vicinity. The folly of intensive development of the desert and its implications for groundwater resource management have been examined elsewhere (Glennon 2002). One fact remains uncontested: Almost all groundwater is in transit to the neighboring surface water (Sophocleous 1997). Therefore, usage of groundwater should be reduced to the minimum amount that can be proven not to adversely affect surface water and/or related ecological resources (wetland and riparian) in the vicinity. An interdisciplinary approach is needed, one that goes beyond hydrogeology to encompass surface water, ecohydrology, and socioeconomic aspects. A major rezoning of a rural area into industrial area necessitates that the additional sources of water be clearly identified at the outset. As this study shows, in the case of Boulevard and surrounding communities, this has yet to be accomplished. 8.2 Recommendations Boulevard and surrounding communities are located in southeast San Diego County, where surface water is almost nonexistent and groundwater recharge is a small fraction of precipitation. Therefore, to remain sustainable, the proposed energy projects must be required to import their water from authorized sources elsewhere. This will assure that the actual groundwater capture-to-recharge percentage remains within reasonable bounds. ACKNOWLEDGEMENTS
The author wishes to acknowledge the support of Donna Tisdale and the people of the community of Boulevard, in southeast San Diego County. The assistance of Rosa D. Aguilar, San Diego State University civil engineering graduate student, is gratefully recognized. ENDNOTES
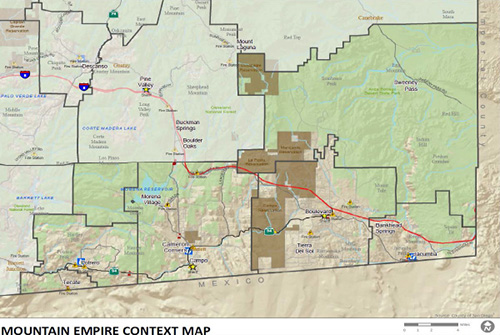
1 The General Plan Ammendment (GPA) would
modify the Boulevard chapter of the Mountain Empire Subregional Plan (Boulevard
Community Plan)
to allow large turbine wind projects through the Major Use Permit process (Wind Energy Ordinance, Draft Environmental Impact Report, 2012).
2
The Campo-Cottonwood Creek Sole-Source Aquifer was designated as such on May 28, 1993,
under the authority of Section 1424(e) of the Safe Drinking Water Act (Federal Register Citation-49 FR 2948, January 24, 1984).
3
The Ocotillo-Coyote Wells Sole-Source Aquifer was designated as such on September 10, 1996,
under the authority of Section 1424(e) of the Safe Drinking Water Act (Federal Register Citation-49 FR 2948, January 24, 1984).
4
In an editorial of Ground Water, Bredehoeft (1997) stated: "Sustainable groundwater development
[sustainable yield] has almost nothing to do with [hydrogeologic] recharge."
5 A flux is the rate of flow of a property through a given area.
The word originates in Latin, where fluxus means flow. In fluid mechanics, flux refers to the rate of flow, or discharge.
6
In an editorial of Ground Water, Sophocleous (1997) stated: "Despite being repeatedly discredited in the
literature, safe yield [defined as the balance between pumping and recharge] continues to be used as a basis of state and local
water management policies, leading to continued groundwater depletion, stream dewatering, and loss of wetland and riparian ecosystems."
7
As told by Walker Frankenberg, field operator for the Jacumba Community Services District on April 19, 2013.
8
As stated in the letter from Mark Wardlaw, Director, County of San Diego Planning and Development Services, to Paul Giese,
Rough Acres Foundation, dated November 20, 2012.
9
As reported in Executive Summary School Acountability Report Card, 2009-10, Clover Flat Elementary School,
39639 Old Hwy 80, Boulevard, CA 91905; Mrs. Barbara Cowling, Principal.
10
Note that 400 mm is the limit between
an arid climate (less than 400 mm) and a semiarid climate (more than 400 mm).
11
As an example of the pervasive effect of a high capture-to-recharge percentage,
Prudic and Herman (1997) have documented downstream flow reversals associated with a capture-to-recharge of 48% (Table 7).
12
Walker Canyon Ecological Reserve is located just north and adjacent to I-8, with its westernmost border about 3 miles east
of the Ribbonwood Rd. exit.
The Reserve is a little over two miles long as it parallels Interstate 8. Its western edge is even with and below Tule Lake; the eastern edge is the Anza-Borrego State Park.
13
Established principles of fluvial geomorphology state that the channel-forming flood has a 2 to 5-yr frequency.
14
The term "heat island" is typically used to describe built-up areas that are hotter than nearby rural areas.
Heat islands can affect communities by increasing summertime peak energy demand, air conditioning costs,
air pollution and greenhouse gas emissions, heat-related illness and mortality, and water quality.
REFERENCES
AECOM. 2012. Groundwater resource evaluation, Shu'luuk Wind project, Campo Reservation, Campo, San Diego County, California, December.
Alley, W. M., T. E. Reilly, and. O. E. Franke. 1999. Sustainability of ground-water resources.
U.S. Geological Survey Circular 1186, Denver, Colorado, 79 p.
Bredehoeft, J. 1997. Safe yield and the water budget myth. Editorial, Ground Water, Vol. 35, No. 6, November-December, 929.
Chebotarev, I. I. 1955. Metamorphism of natural waters in the crust of weathering. Geochimica et Cosmochimica Acta,
Vol. 8, 22-48, 137-170, 198-212.
County of San Diego. 2011a. General Plan Update EIR.
County of San Diego. 2011b. General Plan Update, Boulevard Subregional Planning Area, Mountain Empire Subregional Plan, August.
County of San Diego. 2012a. Soitec Solar Development Program EIR, Planning and Development Services, December.
County of San Diego. 2012b. Approved Minutes/Summary, Boulevard Planning Group, January.
County of San Diego. 2012c. Final Agenda, Boulevard Planning Group, December.
Geo-Logic Associates. 2010. Groundwater Investigation Report, Tule Wind Farm, East San Diego County, California.
Glennon, R. 2002. Water Follies: The Tragedy of Law and the Commons. Inland Press.
Loucks, D. P. 2000. Sustainable water resources management. Water International, Vol. 25, No. 1, 3-10.
L'vovich, M. I. 1979. World water resources and their future. Translation of the original Russian edition (1974), American Geophysical Union, Washington, D.C.
Maimone, M. 2004. Defining and managing sustainable yield. Ground Water, Vol. 42, No. 6, November-December, 809-814.
National Research Council. 2000. Investigating groundwater systems on regional and national scales.
Committee on USGS Water Resources Research, Water Science and Technology Board, Washington, D.C.
Padoma Wind Power. 2009. January 7, 2010 Letter from COPUC re: Padoma's Jordan Wind Power Project.
Ponce, V. M., and A. V. Shetty. 1995a. A conceptual model of catchment water balance. 1. Formulation and calibration. Journal of Hydrology, 173, 27-40.
Ponce, V. M., and A. V. Shetty. 1995b. A conceptual model of catchment water balance. 2. Application to runoff and baseflow modeling. Journal of Hydrology, 173, 41-50.
Ponce, V. M., A. K. Lohani, and P. T. Huston. 1997.
Surface albedo and water resources: Hydroclimatological impact of human activities.
ASCE Journal of Hydrologic Engineering, Vol. 2, No. 4, October.
Ponce, V. M., R. P. Pandey, and S. Ercan. 2000.
Characterization of drought across climatic spectrum.
ASCE Journal of Hydrologic Engineering, Vol. 5, No. 2, April.
Ponce, V. M. 2012a. The salinity of groundwaters.
Ponce, V. M. 2012b. Thompson Creek Groundwater Sustainability Study.
Ponce, V. M. 2013. Comments - Water Issues, to the
Draft Environmental Impact Statement, Shu'luuk Wind Project, Campo Indian Reservation,
San Diego County, California.
Ponce, V. M. 2013. Catchment wetting and water balance. Online article.
Prudic, D. E., and M. E. Herman. 1996. Ground-water flow and simulated effects of development in Paradise Valley,
a basin tributary to the Humboldt River, in Humboldt County, Nevada. U.S. Geological Survey Professional Paper 1409-F.
Scanlon, B. R., K. E. Keese, A. L. Flint, L. E. Flint, C. B. Gaye, W. M. Edmunds, and I. Simmers. 2006.
Global synthesis of groundwater recharge in semiarid and arid regions. Hydrological Processes, 20, 3335-3370.
Seward, P., Y. Xu, and L. Brendock. 2006. Sustainable groundwater use, the capture principle, and adaptive management. Water SA, Vol. 32, No. 4, October, 473-482.
SDG&E. 2009. Environmental Impact Assessment, San Diego Gas & Electric East County Substation Project, August.
SDG&E. 2010. Revised Project Description, East County Substation Footprint Project, prepared by
Insignia Environmental, April 30.
SDG&E. 2011. Final Environmental Impact Report/Environmental Impact Statement, San Diego Gas & Electric East County Substation Project,
Public Utilities Commission, State of California.
SDG&E. 2012. Proponent's Environmental Assessment
for the TL 6931 Fire Hardening/Wind Interconnect Project, December.
Soitec. 2013. Soitec Solar Development Programmatic Environmental Impact Report. January 7, 2013.
Sophocleous, M. 1997. Managing water resources systems: Why "safe yield"
is not sustainable. Editorial, Ground Water, Vol. 35, No. 4, July-August, 561.
U.S. Bureau of Land Management. 2012.
Echanis Wind Energy Project, Hazardous and Solid Waste Management Plan, May 16, 2012, 4 pages.
U.S. Department of Energy. 2012. Energia Sierra Juarez U.S. Transmission Line Project. DOE/EIS-0414, Final Enviromental Impact Statement, Volume 3 - Comments
and Responses Document, Office of Electricity Delivery and Energy Reliability, May, Washington, D.C.
U.S. Geological Survey. 2013. The USGS Water Science School, Water Basics, Where is Earth's water?
World Commission on Environment and Development (The Brundtland Commission). 1987. Our Common Future. The United Nations, New York.
World Water Balance and Water Resources of the Earth. 1978.
U.S.S.R. Committee for the International Hydrological Decade, UNESCO, Paris, France.
| ||||||||||||||||||||||||||||||||||||||||||||||||||||||||||||||||||||||||||||||||||||||||||||||||||||||||||||||||||||||||||||||||||||||||||||||||||||||||||||||||||||||||||||||||||||||||||||||||||||||||||||||||||||||||||||||||||||||||||||||||||||||||||||||||||||||||||||||||||||||||||
 About the author