THE BATTELLE ENVIRONMENTAL EVALUATION SYSTEM
FOR WATER RESOURCE PLANNING
• INTRODUCTION •
The Battelle Environmental Evaluation System (EES) is a methodology for conducting environmental impact analysis developed at Battelle Columbus Laboratories by an interdisciplinary research team under contract with the U.S. Bureau of Reclamation (Dee et al., 1972; Dee et al., 1973). It is based on a hierarchical assessment of environmental quality indicators.
The system is based on a classification consisting of four levels:
- Level I: Categories,
- Level II: Components,
- Level III: Parameters, and
- Level IV: Measurements.
Each category (Level I) is divided into several components, each component (Level II) into several parameters, and each parameter (Level III) into one or more measurements. The EES identifies a total of four (4) categories, eighteen (18) components and seventy-eight (78) parameters.
EES assessment of the environmental impacts of water resources development projects is based on commensurate "environmental impact units" (EIU). Two EIU scores are produced, one 'with' and another 'without' the proposed project. The difference between the two scores is a measure of the environmental impact. The scores are based on the magnitude and importance of specific impacts.
In addition to the EIU scores, the EES labels major adverse environmental impacts with a "red flag." These flags point to fragile elements of the environment, for which more detailed studies are warranted.
Major features of the EES are:
- Its hierarchical classification system;
- Its commensurate unit of measure (EIU); and
- Its flaging of environmentally sensitive areas.
• THE ENVIRONMENTAL EVALUATION SYSTEM •
Table 1 shows the complete list of categories, components, and parameters of the Battelle EES. Column 1 shows the four (4) categories, Column 2 shows the eighteen (18) components, and Column 3 shows the seventy-eight (78) parameters.
The EES methodology is based on the assignment of an importance unit to each parameter. Collectively, these "importance units" are referred to as "parameter importance units" or PIU's. A total of 1000 PIU's is distributed among the 78 parameters based on value judgments [of the system development team]. The individual PIU's are shown in Column 4 of Table 1, the summation component PIU's are shown in Column 5, and the summation category PIU's are shown in Column 6. Effectively, for each parameter i, its (PIU)i represents a weight wi.
| Table 1. Categories, components, and parameters of the Battelle EES. | |||||
| (1) | (2) | (3) | (4) | (5) | (6) |
| Categories | Components | Parameters | Parameter Importance Unit (PIU) | ||
| Parameter | Component | Category | |||
Ecology |
Species and populations |
||||
| 1. Terrestrial browsers and grazers | 14 | 140 | 240 | ||
| 2. Terrestrial crops | 14 | ||||
| 3. Terrestrial natural vegetation | 14 | ||||
| 4. Terrestrial pest species | 14 | ||||
| 5. Terrestrial upland game birds | 14 | ||||
| 6. Aquatic commercial fisheries | 14 | ||||
| 7. Aquatic natural vegetation | 14 | ||||
| 8. Aquatic pest species | 14 | ||||
| 9. Sport fish | 14 | ||||
| 10. Waterfowl | 14 | ||||
Habitats and communities | |||||
| 11. Terrestrial food web index | 12 | 100 | |||
| 12. Land use | 12 | ||||
| 13. Terrestrial rare and endangered species | 12 | ||||
| 14. Terrestrial species diversity | 14 | ||||
| 15. Aquatic food web index | 12 | ||||
| 16. Aquatic rare and endangered species | 12 | ||||
| 17. River characteristics | 12 | ||||
| 18. Aquatic species diversity | 14 | ||||
| Ecosystems | Descriptive only | - | - | ||
Pollution |
Water | ||||
| 19. Basin hydrologic loss | 20 | 318 | 402 | ||
| 20. BOD | 25 | ||||
| 21. Dissolved Oxygen | 31 | ||||
| 22. Fecal coliforms | 18 | ||||
| 23. Inorganic carbon | 22 | ||||
| 24. Inorganic nitrogen | 25 | ||||
| 25. Inorganic phosphate | 28 | ||||
| 26. Pesticides | 16 | ||||
| 27. pH | 18 | ||||
| 28. Stream flow variation | 28 | ||||
| 29. Temperature | 28 | ||||
| 30. TDS | 25 | ||||
| 31. Toxic substances | 14 | ||||
| 32. Turbidity | 20 | ||||
Air | |||||
| 33. Carbon monoxide | 5 | 52 | |||
| 34. Hydrocarbons | 5 | ||||
| 35. Nitrogen oxides | 10 | ||||
| 36. Particulate matter | 12 | ||||
| 37. Photochemical oxidants | 5 | ||||
| 38. Sulfur dioxide | 10 | ||||
| 39. Other | 5 | ||||
Land | |||||
| 40. Land use | 14 | 28 | |||
| 41. Soil erosion | 14 | ||||
| Noise | 42. Noise | 4 | 4 | ||
Aesthetics |
Land | ||||
| 43. Geologic surface material | 6 | 32 | 153 | ||
| 44. Relief and topographic character | 16 | ||||
| 45. Width and alignment | 10 | ||||
Air | |||||
| 46. Odor and visual | 3 | 5 | |||
| 47. Sounds | 2 | ||||
Water | |||||
| 48. Appearance | 10 | 52 | |||
| 49. Land and water interface | 16 | ||||
| 50. Odor and floating materials | 6 | ||||
| 51. Water surface area | 10 | ||||
| 52. Wooded and geologic shoreline | 10 | ||||
Biota | |||||
| 53. Animals - domestic | 5 | 24 | |||
| 54. Animals - wild | 5 | ||||
| 55. Diversity of vegetation types | 9 | ||||
| 56. Variety within vegetation types | 5 | ||||
| Manmade objects | 57. Manmade objects | 10 | 10 | ||
Composition | |||||
| 58. Composite effect | 15 | 30 | |||
| 59. Unique composition | 15 | ||||
Human interest |
Educational/scientific packages | ||||
| 60. Archaeological | 13 | 48 | 205 | ||
| 61. Ecological | 13 | ||||
| 62. Geological | 11 | ||||
| 63. Hydrological | 11 | ||||
Historical packages | |||||
| 64. Architecture and styles | 11 | 55 | |||
| 65. Events | 11 | ||||
| 66. Persons | 11 | ||||
| 67. Religions and cultures | 11 | ||||
| 68. Western frontier | 11 | ||||
Cultures | |||||
| 69. Indians | 14 | 28 | |||
| 70. Other ethnic groups | 7 | ||||
| 71. Religious groups | 7 | ||||
Mood/atmosphere | |||||
| 72. Awe-inspiration | 11 | 37 | |||
| 73. Isolation/solitude | 11 | ||||
| 74. Mystery | 4 | ||||
| 75. Oneness with nature | 11 | ||||
Life patterns | |||||
| 76. Employment opportunities | 13 | 37 | |||
| 77. Housing | 13 | ||||
| 78. Social interactions | 11 | ||||
| Sum total of parameter importance units (PIU) | 1000 | ||||
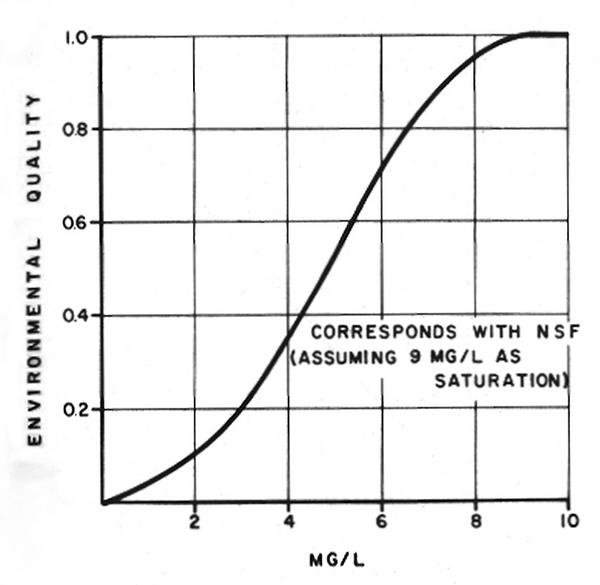
Each PIUI or wi requires a specific quantitative measurement. The methodology converts different measurements into common units by means of a scalar or "value function." A scalar has the specific measurement in the x-axis and a common environmental quality scale or "value" in the y-axis. The latter varies in the range 0 ≤ Vi ≤ 1. A value of Vi = 0 indicates very poor quality, while Vi = 1 indicates very good quality. Figure 1 shows an example of a typical scalar, that of dissolved oxygen (DO) (Table 1, Column 3, number 21). In this figure, Vi (environmental quality) varies in the range 0-1 as a function of DO concentration (mg/L).
|
Values of Vi = Vi, 0 are obtained for conditions 'without' the project, and Vi = Vi, 1 for conditions 'with' the project. The condition 'without' the project represents the current condition, while that 'with' the project represents the predicted future condition.
The environmental impact EI is evaluated as follows:
EI = ∑ [ Vi, 1 wi ] - ∑ [ Vi, 0 wi ]
for i = 1 to n, where n = number of parameters (78).
For EI > 0, the situation 'with' the project is better than 'without' the project, indicating that the project has positive environmental benefits. Conversely, for EI < 0, the situation 'with' the project is worse than 'without' the project, indicating that the project has negative environmental benefits, i.e., certain negative impacts. A large negative value of EI indicates the existence of substantial negative impacts.
The assigned weights or PIU's represent the relative importance of each parameter within the overall system. Once established by society, they should be kept constant; otherwise, the environmental impact assessment would be difficult to replicate.
The potential problem areas are represented by those parameters for which the Vi value changes significantly in the adverse direction, as measured by the following relation (in percent):
ΔVi (%) = 100 (Vi, 0 - Vi, 1) / Vi, 0
These parameters are tagged with 'red flags' to indicate potential problems which may warrant more detailed attention. For parameters in the ecology category, a minor red flag applies when 5% < ΔVi < 10%; a major red flag when ΔVi > 10 %. In all other categories, a minor red flag applies when ΔVi < 30%, or ΔVi < 0.1 (in absolute value, per unit); a major red flag when ΔVi ≥ 30%, or ΔVi ≥ 0.1 (in absolute value, per unit).
• USE OF THE EES •
The EES can be applied for the evaluation of project impacts, to select specific alternatives, or, during the planning process, to minimize potential adverse impacts of proposed projects. In the later case, a feedback loop is used to continually modify the proposed project through successive iterations. Projects developed with the help of EES are expected not only to minimize environmental impacts, but also to improve selected portions of the environment.
REFERENCES
Dee, N., J. Baker, N. Drobny, K. Duke, and D. Fahringer. 1972. Environmental evaluation system for water resource planning (to Bureau of Reclamation, U.S. Department of Interior). Battelle Columbus Laboratory, Columbus, Ohio, January, 188 pages.
Dee, N., J. Baker, N. Drobny, K. Duke, I. Whitman, and D. Fahringer. 1973. An environmental evaluation system for water resource planning. Water Resources Research, Vol. 9, No. 3, June, 523-535.