 |
| Fig. 1 Headwaters of the La Leche basin, near Incahuasi, Lambayeque, Peru. |
LAMBAYEQUE, PERU
SECOND PROJECT REPORT
PRELIMINARY FINDINGS
APRIL 30, 2008
Dr. Victor M. Ponce
Hydrology Consultant
1. INTRODUCTION
D'Leon Consulting Engineers, of Long Beach, California, hereafter referred to as DLCE,
has a contract with the Regional Government of Lambayeque, Peru, hereafter RGL,
to support the development of the La Leche River flood control project.
The study aims to enhance flood control and water conservation in the basin of the La Leche river, which has
suffered major floods caused by the El Niño meteorological phenomenon (Fig. 2).
 |
|
Fig. 2 El Niño conditions along the Equatorial Pacific (Source: UC Santa Barbara). |
The funding agency is the U.S. Trade and Development Agency (UST&DA). The local government agency in charge of the project is the Proyecto Especial Olmos-Tinajones, hereafter PEOT. Dr. Victor M. Ponce, hereafter the Consultant, has a subcontract with DLCE to perform the hydrologic component of the study.
This second report is submitted in partial fulfillment of the requirements of the contract between the Consultant and DLCE. The report contains a description of the progress to date and a summary of preliminary findings.
2. PROJECT DESCRIPTION
The project encompasses the feasibility design of the structure [or structures] to control floods and store flood waters [for future use] in the La Leche river basin. Two damsites are currently being considered: (1) La Calzada, and (2) Calicantro (DEPOLTI, 1998). While La Calzada is an instream dam, Calicantro is an off-stream dam. The comparison between these alternatives is given in Table 1.
| |||||||||||||||||||||||||
A dam only at La Calzada would go a long way to store the floods. However, in order to be effective for this purpose, most of the active storage would have to be retarding-pool storage (Fig. 9). Therefore, a dam at La Calzada cannot effectively serve the purpose of storage of flood waters for later use. In addition, a large instream reservoir such as that of La Calzada would have a tendency to store great quantities of sediment, decreasing the service life of the structure (preliminary estimates indicate that it may be less than 100 years).
A dam only at Calicantro would store great quantities of water for later use. However, it could not serve the purpose of effectively attenuating infrequent La Leche floods. Therefore, a dam at Calicantro will not solve the flood hazard in the La Leche river. A Calicantro dam would not be subject to deposition of great quantities of sediment, increasing the service life, provided the proper exclusion works are in place and are operated effectively.
The solution is to build two dams, one at La Calzada, primarily for flood control, and another at Calicantro, to store water for irrigation and other uses. An added feature of the two-dam strategy is that the useful life of the reservoirs, particularly the one at La Calzada, will be increased. The water will not stay too long in La Calzada, and it could be desilted prior to sending it to Calicantro for storage.
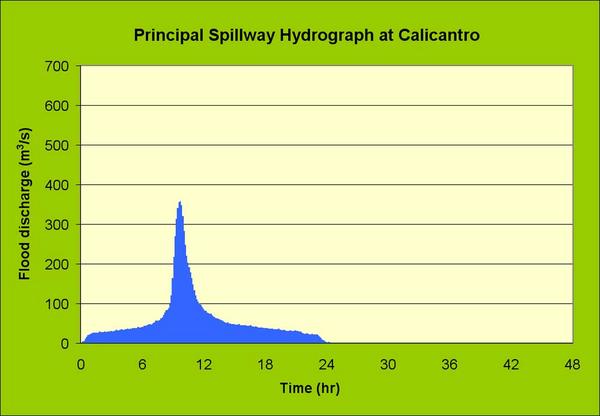
The dam at La Calzada requires a thorough appraisal of the flood hydrology, since it is a major dam located upstream of significant population centers and important infrastructure. The dam at Calicantro has a comparatively large volume and small drainage area; therefore, regional floods should not be a problem, assuring the safety of the dam against overtopping. The spillway would still need to be designed, and its capacity calculated.
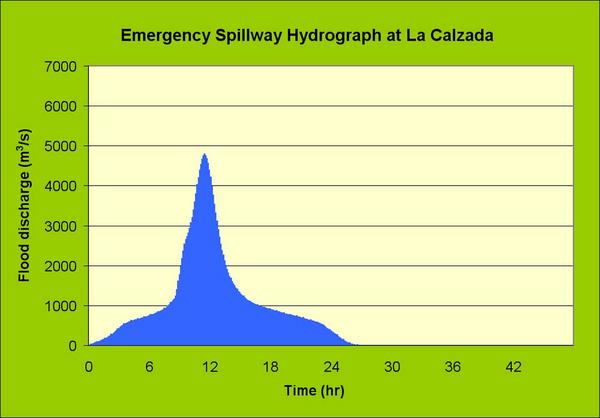
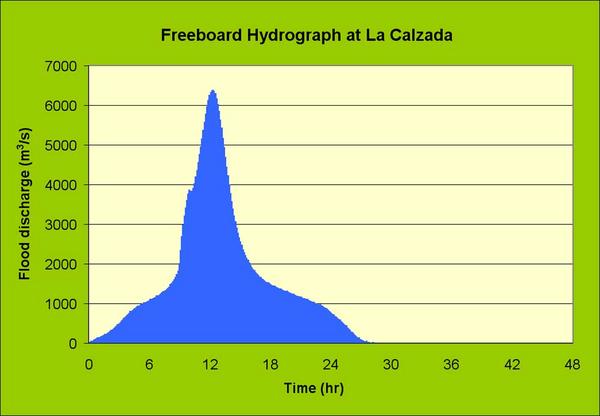
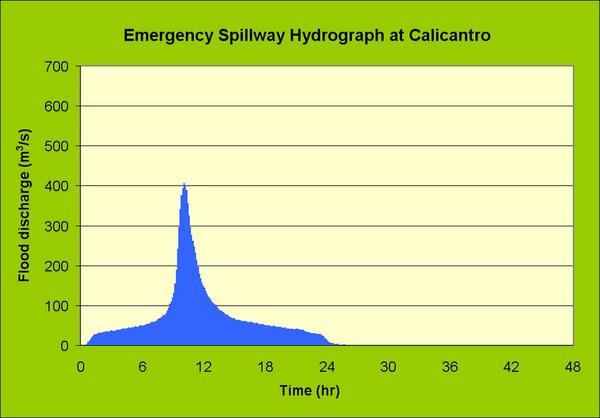
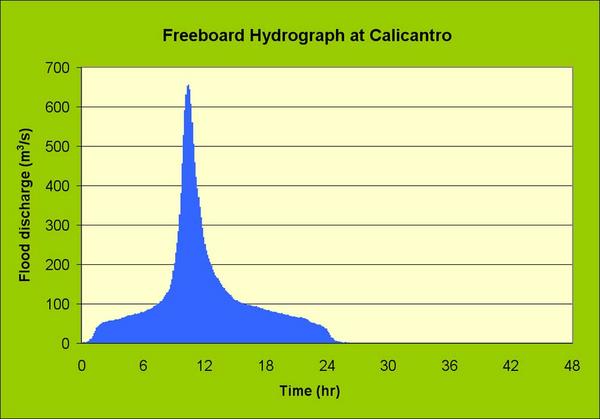
The approach is to model the event rainfall-runoff process in the entire La Leche basin, from headwaters to La Calzada. This allows the calculation of flood hydrographs to determine the capacity of principal and emergency spillways, and the [minimum] elevation of the dam crest (freeboard). The principal spillway (PSH), emergency spillway (ESH), and freeboard hydrograph (FBH) are determined for La Calzada. Appropriate design hydrographs for Calicantro are also determined.
3. BASIN DESCRIPTION
The basin of the La Leche river, from headwaters to La Calzada, has a drainage area of 907.36 km2.
The basin is located in the western slopes of the Western Peruvian Andes.
The largest town within the basin is Incahuasi, with close to 15,000 inhabitants, including the neighboring hamlets.
The distance from Chiclayo, the closest major population center, to Incahuasi is 120 km.
The time of travel along a winding unpaved road is about 6 hours. Seasonal rainfall can make travel to and from Incahuasi
hazardous and subject to delays.
The headwaters of the La Leche basin are at Cerro Choicopico, at an elevation of 4,230 m above mean sea level.
The La Leche river has two major tributaries,
the Moyan and Sangana rivers.
The hydraulic length of the La Leche river [to La Calzada] along the Moyan tributary, is 44,397 m.
The hydraulic length of the La Leche river along the Sangana tributary is 44,591 m.
Channel slopes vary from as steep as 24% in Quebrada Cascabamba, to 1% near La Calzada.
Mean velocities during flood events vary between 3 and 4 m/s.
The time of concentration during flood events varies from 3 to 4 hr.
The basin has a mixed land use of woodlands, grasslands, and croplands.
Average terrain slopes range from 20% to 50%, encouraging surface runoff.
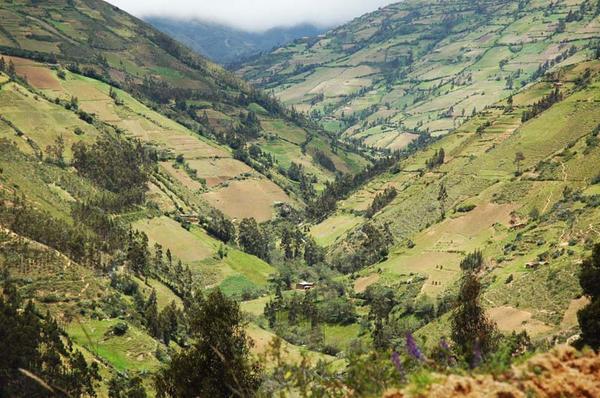
Steep slopes feature exposed rock and very little soil, which discourages infiltration (Fig. 3).
Rainfall varies spatially within
the basin; storms are more intense below elevations of 1500 m (toward the west) and less intense above 1500 m (toward the east).
The climate is semiarid toward the west (near the coast), grading to subhumid toward the east (highlands).
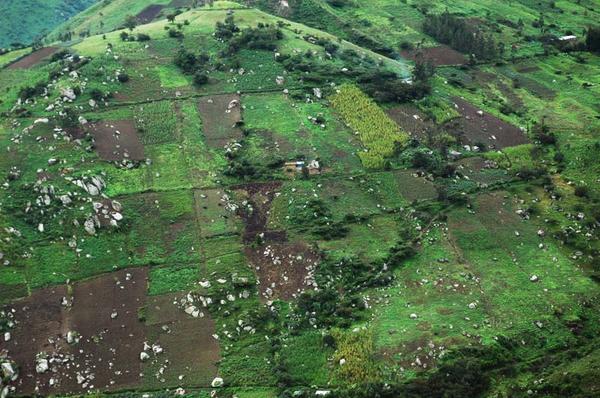 |
| Fig. 3 Rock outcrops and agriculture on steep slopes of La Leche basin. | ||||||||||||||||||||||||||||||||||||||||||||||||||||||||||||
| ||||||||||||||||||||||||||||||||||||||||||||
The maximum recorded 24-hr storm in Puchaca is 150.2 mm; in Tocmoche it is 110.0 mm; in Incahuasi, 81.0 mm. Storms are of greater intense in the vicinity of Puchaca and less intense near Incahuasi, with Tocmoche lying somewhere in the middle.
4. MODELING STRATEGY
There is a need to determine flood discharges from 100-yr to 10,000-yr return periods.
The only streamgaging station, at Puchaca, has records going back to 1956 (Fig. 4).
The maximum flood discharge recorded at Puchaca is 579.75 m3/s.
Geomorphological evidence suggests that long-term flood discharges at La Calzada may have exceeded this value.
The great alluvial plains of the La Leche river could not have been formed without the occurrence of great floods.
 |
| Fig. 4 Gaging station, Rio La Leche at Puchaca. |
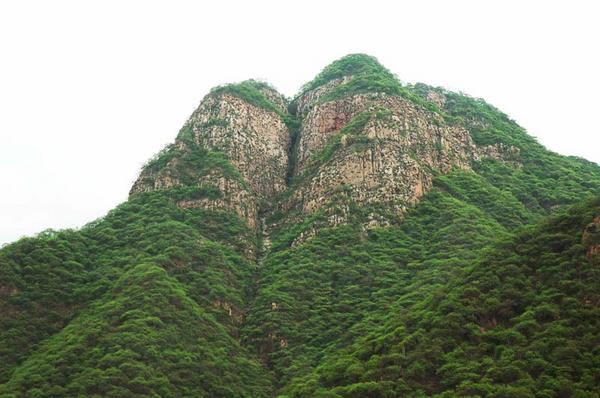 |
| Fig. 5 Cerro Lajas de Tongon, near the confluence of the Moyan and Sangana rivers, La Leche basin. |
The model is event-driven because it simulates flood flows in situations where direct runoff constitutes the majority of the runoff, i.e., where baseflow is small and does not appreciably contribute to the flood peak. Unlike continuous modeling, event-driven modeling does not require long-term [error-prone] moisture accounting. Thus, results of event-driven flood simulations are consequent with typical variations in parameter ranges. Moreover, the model's unique generalized topological structure enables it to consider a dendritic basin of any order. Flood hydrographs are seamlessly calculated and expressed at any desired point along the stream network.
The model is a rainfall-runoff model because it seeks, through a suitable transform, to convert effective rainfall (mm) into runoff (m3/s). The transform is accomplished by convoluting the NRCS unit hydrograph with the effective storm pattern, to obtain the flood hydrograph at each subbasin outlet (Natural Resources Conservation Service, 1985b). The applicability of the NRCS unit hydrograph for midsize basins, i.e, those with drainage areas ranging from 1 to 1000 km2 [such as those of the La Leche river] has been thoroughly documented (Ponce, 1989).
The model is computational because its discretizes the governing equations of mass and momentum conservation in the space-time domain by using a suitable numerical scheme. The latter is subject to stability and convergence requirements. Stability refers to the ability of the scheme to march in time without generating unbounded error growth. Convergence refers to the ability of the scheme to reproduce the terms of the differential equation with sufficient accuracy. The differential equations are expressed in finite difference form, by using space and time intervals Δx and Δt, respectively. The numerical properties of the model depend on the proper choice of spatial and temporal resolution, i.e., on the Courant number. As such, the latter is seen to govern not only the stability but also the convergence of numerical schemes of hyperbolic systems of partial differential equations.
In summary, the RAINFLO© model is based on more than fifty
years of research on hydrologic processes, including abstraction (with the runoff curve number),
rainfall-runoff transform (with the NRCS unit hydrograph), and
stream channel routing (with the Muskingum-Cunge method). The combination of deterministic/conceptual methods of relevant hydrologic processes
renders the model particularly attractive.
6. DATA COLLECTION
The data needs are the following:
6.1 Basin topology
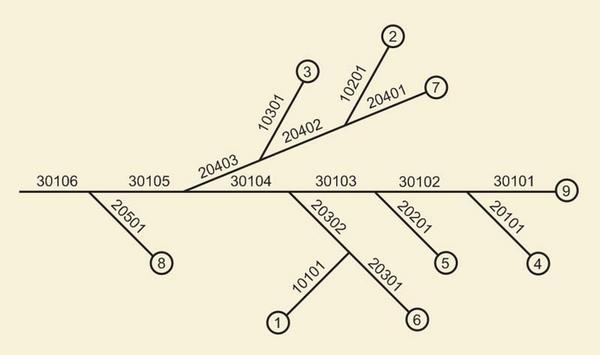
The La Leche basin, from headwaters to La Calzada, is divided into nine (9) upland subbasins and seventeen (17) reach subbasins,
for a total of twenty-six (26) subbasins (Fig. 6).
Runoff in the subbasins can be local or imported. Local runoff originates within each subbasin and it is calculated by
convolution of the unit hydrograph.
Imported runoff originates upstream of a reach subbasin and it is routed through the reach using the Muskingum-Cunge method.
Upland subbasins are numbered consecutively (from 1 to 9) in order of increasing neighboring reach subbasin.
Reach subbasins are numbered, from upstream to downstream, using a 5-digit order-branch-reach topological number (Fig. 6).
 |
| Fig. 6 Topology of the La Leche basin. |
6.2 Subbasin properties
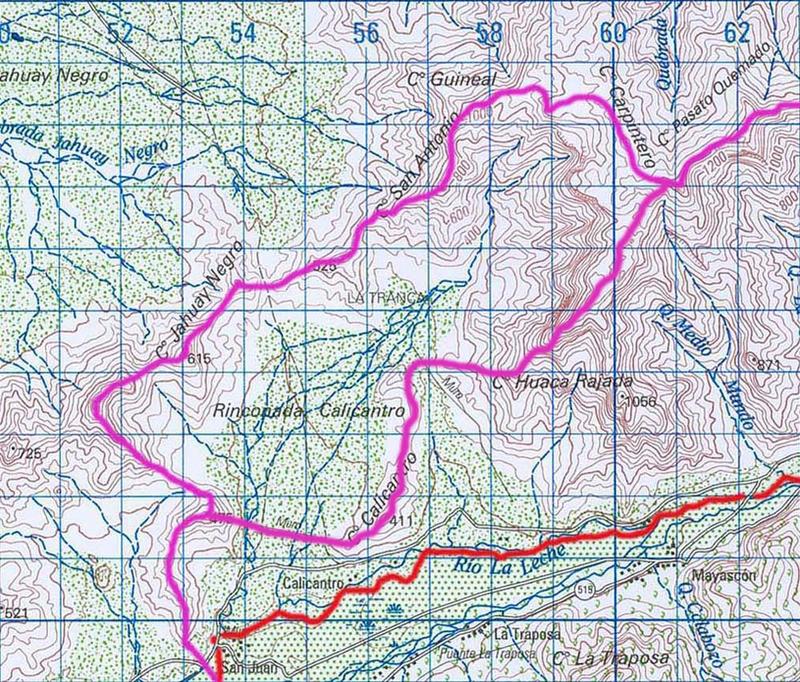
The subbasin geometric properties are obtained from 1:100,000 scale topographic maps (IGN Incahuasi and Jayanca sheets). The subbasin delineation is shown in Fig. 7. This figure includes the drainage area of the La Leche river to a point downstream of the Calicantro site (Fig. 14). Geographic features are shown in Table 3. Drainage areas for subbasins are delineated following the peaks and saddles of the topography. Hydraulic lengths and channel slopes are obtained from the maps. Hydrologic properties are shown in Table 4. In this table, the last reach subbasin (30106) includes the hydrologic properties only to La Calzada.
The drainage areas vary from a low of 708 ha (Quebrada del Verde) to a high of 8,815 ha (Rio Moyan 3), with an average of 3,490 ha. The total drainage area for the La Leche river at La Calzada is 90,736 ha, or 907.36 km2. The hydraulic length of the Moyan/La Leche river, from headwaters to proposed damsite is 44,397 m. The hydraulic length of the Sangana/La Leche river is 44,591 m. The average channel slope varies from a high of 0.24 for Quebrada Cascabamba (upland subbasin 6), to a low of 0.01 for Rio La Leche 2, immediately upstream of La Calzada (reach subbasin 30106).
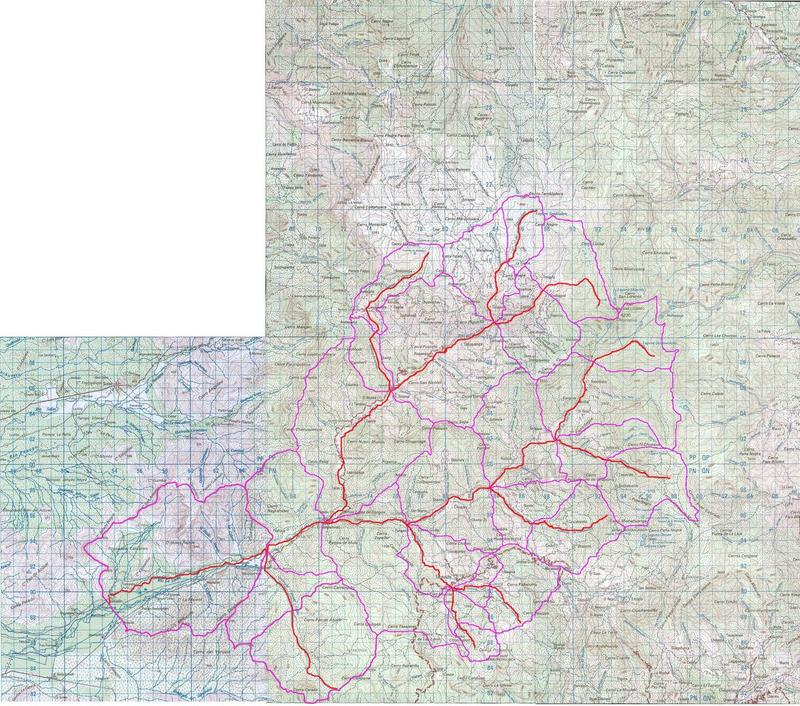 |
| Fig. 7 The La Leche basin, showing stream network in red and subbasin boundaries in purple. |
6.3 Terrain slopes
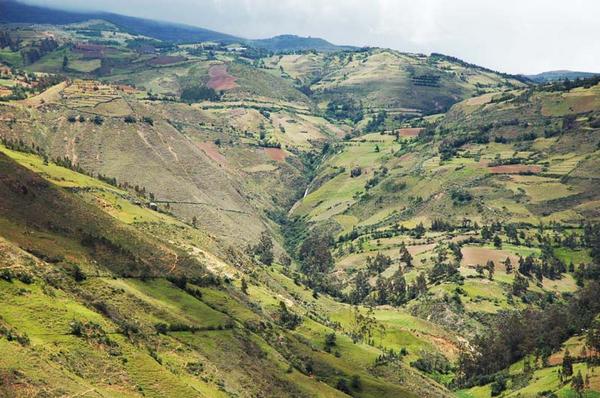
The terrain slopes across the La Leche basin were sampled on a 1-km2 grid. Average terrain slopes are shown in Table 5. Average terrain slopes vary from a low of 19.7% in Quebrada Tembladera to a high of 50.3% in Rio Sangana 2, with an average of 33.7% for the entire La Leche basin [to La Calzada] (Fig. 8).
 |
| Fig. 8 Typical slopes of the Moyan/La Leche basin. |
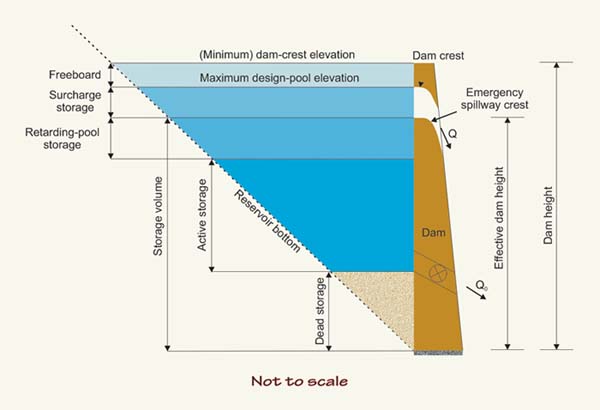 |
| Fig. 9 Definition sketch for reservoir storage volumes (Ponce, 1989). |
The 24-hr annual maximum storm precipitation records for the Puchaca, Tocmoche, and Incahuasi stations, up to 1998, were obtained from Perez Becerra (2006). The remainder of the record (up to 2002 for Puchaca, and 2007 for Tocmoche and Incahuasi), were obtained from SENAMHI. The ordered values are shown in Table 6.
6.5 Hydrologic soil groups
The hydrologic soil groups for the La Leche basin have been estimated by Consorcio Salzgitter-Lagesa (1984) as follows: D for the upper basin, and B for the middle and lower basin. Perez Becerra (2006) has estimated hydrologic soil groups as varying between B, C, and D, with three types of land uses: (1) impermeable soil or rock, (2) pasture, and (2) shrub. The average of 28 subbasins considered in the Perez Becerra study is CNII = 85.
Pending field verification, the hydrologic soil group for the entire La Leche basin is estimated as D (rock outcrops and clay soil). The predominant land use is mixed woodland/grassland and cropland (Fig. 10). The percent aerial coverage and hydrologic surface condition are estimated using Google Earth Pro© software. The CNII table values are given by Ponce (1989), among others.
 |
|
Fig. 10 Mixed land use in the Moyan basin. |
Table 7 shows aerial weighted CNII values. The values shown in the last column of this table were weighted with the respective subbasin drainage areas to obtain a basinwide CNII = 83 [shown in the last row of the last column]. This value is a little smaller than the average value of Perez Becerra (2006). Antecedent moisture condition AMCIII is assumed (Ponce, 1989); the corresponding basinwide CNIII = 93. The assumed hydrologic soil groups and hydrologic surface conditions remain to be verified in the field prior to the completion of this study.
6.6 Manning's n
Manning's n roughness coefficients are shown in Table 8 (Barnes, 1967). Observational and other evidence indicates that the tributaries of the La Leche river are able to move very large boulders, with some aproaching 1 m in diameter (Fig. 18). Inbank values of Manning's n for most reaches are taken as 0.075. Eight-point cross-sectional data is shown in Table 8 and Table 9.
6.7 Cross-sectional geometry
Data on typical cross sections is currently being collected. Pending field work in progress, typical cross sections were estimated for all reach subbasin stream channels using stream order and subbasin drainage areas, supported with field observations and experience. Estimated eight-point typical cross-sectional data is shown in Table 8 and Table 9.
6.8 Work in progress
Work is in progress to verify and complete the hydrologic soil group, hydrologic surface condition, and frictional and cross-sectional data.
7. STORM FREQUENCY MODELING
Storm frequency modeling was accomplished using the Log Pearson III and Gumbel methods (U.S. Interagency Advisory Committee on Water Data, 1983; Ponce, 1989).
The values shown in Table 6
were used to calculate 100-yr and 10,000-yr 24-hr storms for the three stations: Puchaca, Tocmoche, and Incahuasi.
These values are shown in Table 10, together with the adopted values,
taken as the average of the two methods. Also shown in Table 10 are the
applicable 24-storm precipitation for the principal spillway, emergency spillway, and freeboard hydrographs (Section 6.4).
The 100-yr and 10,000-yr design storm depth vs elevation data of Table 10 was taken as a
reference set. For each subbasin,
design storm precipitations
were obtained by logarithmic interpolation, given the elevation of the subbasin's centroid.
The design storm precipitations are shown in Table 11.
Weighing the storm precipitations with the respective drainage areas leads to
the basinwide storm precipitations shown in the last row of Table 11.
8. MODEL RESULTS
The design storms of Table 11
are used to drive the RAINFLO© model.
The subbasin curve numbers are those shown in Table 7.
Wet antecedent moisture condition (AMCIII) is assumed.
The rainfall-runoff transform [NRCS unit hydrograph] is performed using the data of Table 4
and Table 5.
Average velocities are estimated in the range 3-4 m/s.
The frictional and cross-sectional data is shown in Table 8
and Table 9.
The model was run for a period of 48 hr using a time interval of 7.5 minutes.
To assure the accuracy of the routing method, the Courant numbers were verified to be in the range 0.5 ≤ C ≤ 2.0 (Ponce and Theurer, 1982;
Ponce, 1989).
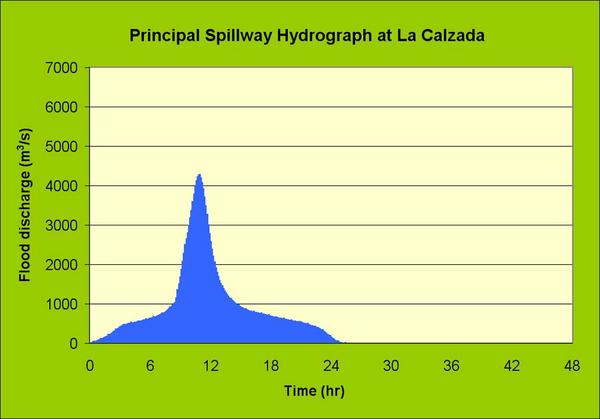
Design flood hydrographs are shown in Figs. 11, 12, and 13.
A summary of design flood discharges is shown in Table 12.
 |