|
|
CIVE 633 - ENVIRONMENTAL HYDROLOGY
MANUAL 71 LECTURE 02, CHAPTERS 12 AND 13
|
|
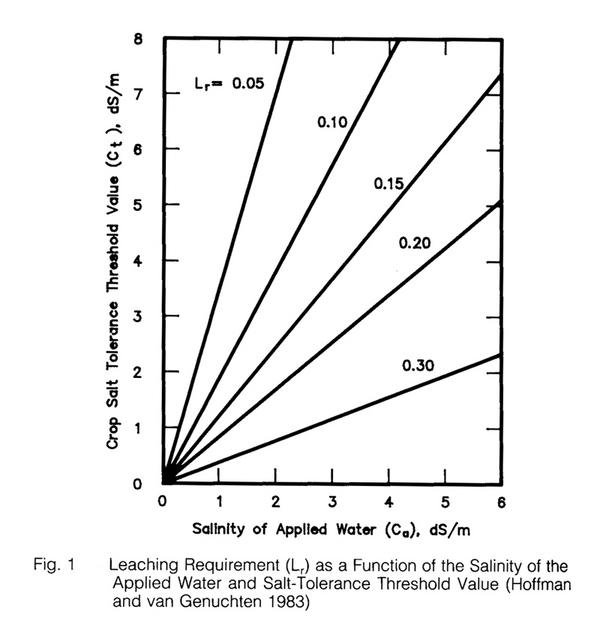
LEACHING REQUIREMENT [243]
|
- The leaching fraction is the ratio of depth of drainage to depth of applied water (irrigation plus rainfall).
- The leaching fraction is the ratio of salt content of applied water to salt content of drain water.
- The leaching fraction is the ratio of electrical conductivity of applied water to electrical conductivity of drain water.
- Fig. 1 shows that relationship between the salinity of applied water (Ca), in dS/m, and the crop salt tolerance threshold value
(Ct), in dS/m.
- For example, assume tomatoes are to be grown in an arid region, and irrigated with water of ECi = 3 dS/m. Assume rainfall to be
insignificant.
- The salt tolerance threshold value of tomatoes is Ct = 2.5 dS/m.
- From Fig. 1, with ECi = 3 dS/m, and Ct = 2.5 dS/m, the leaching requirement Lr = 0.2.
- This means that 20% of the applied water will have to drain.
- That means that if PET = 100 units, the amount applied will have to be 125 units, 25 units will drain, and 25/125 will be Lr = 0.2.
|
|
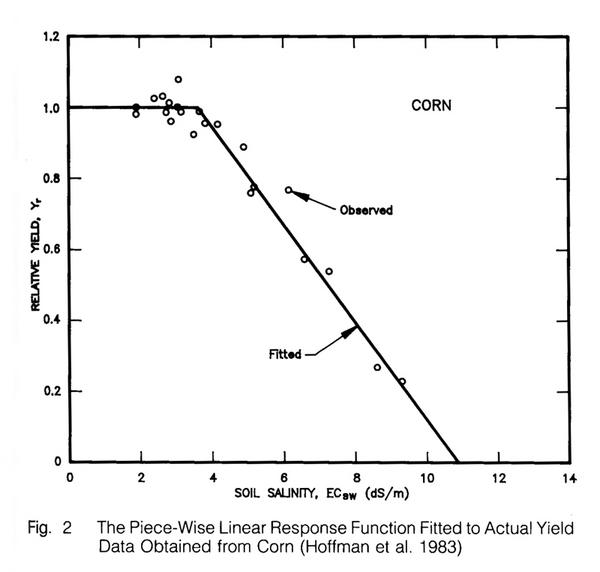
YIELD RESPONSE FUNCTIONS [268]
|
- The yield response function is expressed as follows:
Yr = [100 - b(EC - a)]/100 [%]
or
Yr = 1 - (b/100)(EC - a) [ratio]
where
Yr = relative yield, in % or ratio;
a = salt tolerance threshold value, applicable to a given crop, in dS/m;
b = slope of yield reduction line, expressed in % reduction per dS/m, applicable to a given crop; and
EC = electrical conductivity of a saturated soil extract taken from the root zone.
- For instance, if a crop has a = 4 and b = 20, the relative yield would be:
At EC ≤ 4 dS/m: Yr = 1.0
At EC = 5 dS/m: Yr = 0.8
At EC = 6 dS/m: Yr = 0.6
At EC = 7 dS/m: Yr = 0.4
At EC = 8 dS/m: Yr = 0.2
At EC = 9 dS/m: Yr = 0.0
- For instance, if a crop has a = 1.7 and b = 12, the relative yield would be:
At EC ≤ 1.7 dS/m: Yr = 1.0
At EC = 2 dS/m: Yr = 1.0 - (12 × 0.3)/100 = 0.964
At EC = 3 dS/m: Yr = 0.844
At EC = 4 dS/m: Yr = 0.724
At EC = 5 dS/m: Yr = 0.604
At EC = 6 dS/m: Yr = 0.484
At EC = 7 dS/m: Yr = 0.364
At EC = 8 dS/m: Yr = 0.244
At EC = 9 dS/m: Yr = 0.124
At EC = 10 dS/m: Yr = 0.004
Table 1. Salt tolerance parameters of herbaceous crops:
Fiber and grains
| Crop | a | b | Rating
| Barley | 8.0 | 5.0 | T
| Bean | 1.0 | 19.0 | S
| Broad bean | 1.6 | 9.6 | MS
| Corn | 1.7 | 12.0 | MS
| Cotton | 7.7 | 5.2 | T
| Cowpea | 4.9 | 12.0 | MT
| Flax | 1.7 | 12.0 | MS
| Peanut | 3.2 | 29.0 | MS
| Rice | 3.0 | 12.0 | S
| Rye | 11.4 | 10.8 | T
| Sorghum | 6.8 | 16.0 | MT
| Soybean | 5.0 | 20.0 | MT
| Sugar beet | 7.0 | 5.9 | T
| Sugarcane | 1.7 | 5.9 | MS
| Wheat | 6.0 | 7.1 | MT
| Wheat (semidwarf) | 8.6 | 3.0 | T
| Wheat (durum) | 5.9 | 3.8 | T
| | | | | | | | | | | | | | | | | | |
Table 2. Salt tolerance parameters of herbaceous crops:
Vegetables and fruits
| Crop | a
| b | Rating
| Asparragus | 4.1
| 2.0 | T
| Bean | 1.0
| 19.0 | S
| Beet, red | 4.0
| 9.0 | MT
| Broccoli | 2.8
| 9.2 | MS
| Cabbage | 1.8
| 9.7 | MS
| Carrot | 1.0
| 14.0 | S
| Celery | 1.8
| 6.2 | MS
| Cucumber | 2.5
| 13.0 | MS
| Eggplant | 1.1
| 6.9 | MS
| Lettuce | 1.3
| 13.0 | MS
| Onion | 1.6
| 16.0 | S
| Pepper | 1.5
| 4.0 | MS
| Potato | 1.7
| 12.0 | MS
| Radish | 1.2
| 13.0 | MS
| Spinach | 2.0
| 7.6 | MS
| Squash, scallop | 3.2
| 16.0 | MS
| Squash, zucchini | 4.7
| 9.4 | MT
| Strawberry | 1.0
| 33.0 | S
| Sweet potato | 1.5
| 11.0 | MS
| Tomato | 2.5
| 9.9 | MS
| Turnip | 0.9
| 9.0 | MS
| | | | | | | | | | | | | | | | | | | | | | |
Table 3. Salt tolerance parameters of woody crops
| Crop | a
| b | Rating
| Almond | 1.5
| 19.0 | S
| Apricot | 1.6
| 24.0 | S
| Blackberry | 1.5
| 22.0 | S
| Boisenberry | 1.5
| 22.0 | S
| Date palm | 4.0
| 3.6 | T
| Grape | 1.5
| 9.6 | MS
| Grapefruit | 1.8
| 16.0 | S
| Orange | 1.7
| 16.0 | S
| Peach | 1.7
| 21.0 | S
| Plum, prune | 1.5
| 18.0 | S
| | | | | | | | | | | |
|