|
|
CIVE 633 - ENVIRONMENTAL HYDROLOGY
STANDING CROP, PRODUCTIVITY, AND GROWTH LIMITATION
|
- Standing crop is synonymous with biomass: quantity per volume or area.
- Standing crop is general; biomass refers to mass.
- Productivity is the rate of biomass formation.
- Turn over rate (1/day) = productivity (gr/m3/day) / biomass (gr/m3)
- Example: 30 gr/m3/day / 300 gr/m3 = 1/10 per day (biomass replaced)
- Energy is lost at each transfer in the food chain.
- Productivity must always decrease from primary producer (green plants) to secondary producers (grazers and predators).
- Productivity usually decreases by a factor of 10 at each trophic level.
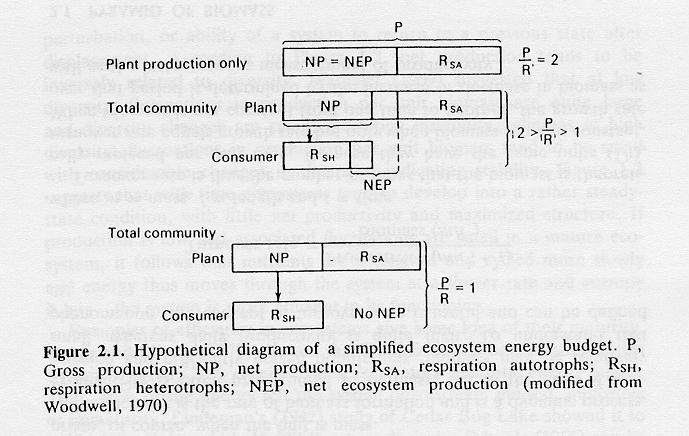
- Gross production (P) consists of net production (NP) plus respiration (R).
- Net production (NP) is the amount of organic matter fixed and transferable to the next trophic level.
- In an ecosystem with plants only, net production by primary producers (NP) equals net ecosystem production (NEP).
- This net production (NP) is available for harvest and grazing by primary consumers (secondary producers).
- In an ecosystem with consumers (primary and secondary) present,
NEP is the sum of net production not consumed plus the production (realized growth) of consumers (secondary production) (Fig. 2.1).
- With plants only, assuming R = 0.5 P for simplicity, the ratio of gross production to respiration (P:R) is 2.
- This represents energy surplus.
- With consumers present, the ratio P:R decreases.
- In mature, stable ecosystems, the ratio P:R approaches 1 from above (Say 1.01).
- In heterotrophic, or allochthonous-fed systems, P:R ratios are typically less than 1.
- This represents energy deficit.
|
2.3 EFFICIENCY OF ENERGY TRANSFER
|
- Photosynthesis is rather inefficient.
- For terrestrial systems, efficiency in light utilization is about 1%.
- In water it is much lower (0.1-0.4%); scattering efects by water on light results in lower efficiency.
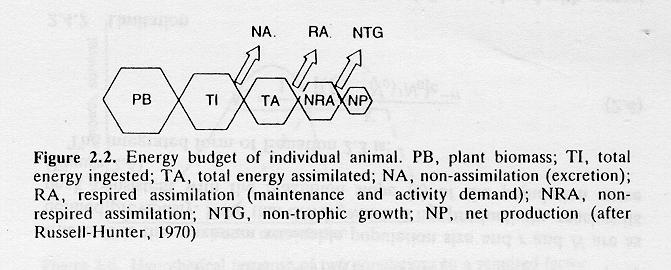
- Utilization of primary productivity through secondary production is nominally 10%, but ranges from 5 to 20%.
- The 80% to 95% that is lost at each trophic level is through respiration.
- The steps involved in handling energy at the grazer level are shown in Fig. 2.2.
- Waste input disrupts structure by eliminating efficient energy utilizers.
- Large populations of unconsumed producers indicates a degradation of the ecosystem dynamics.
|
2.4 POPULATION GROWTH AND LIMITATION
|
- Growth is exponential in an environment where resources are unlimited.
- Typical growth rates range from 1% per year for humans, to 100% per day for algae, to 300% per hour for bacteria.
- In a typical case, the population cannot continue to increase because some resource will become limiting.
- J-shaped growth curves represent first a population boom followed by a crash.
- S-shaped growth curves represent the gradual increasing effect of environmental resistance.
- The yield of a crop will be limited by the essential nutrient that is most scarce relative to the needs of the organism.
- Yield or productivity will depend on the qualitative or quantitative deficiency or excess of any environmental factor, approaching the limits of tolerance of the population
in question.
- Aquatic environmental factors include:
- toxic inhibitors
- quantity and quality of food resources
- micronutrients and macronutrients
- temperature
- dissolved solids (salinity, salt ions)
- sediment
- light
- water current velocity
- water depth
- dissolved oxygen (DO)
- pH (availability of protons).
- pE (redox potential) (availability of electrons).
|