|
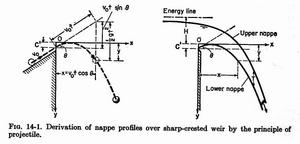
x = vot cosθ
y = -vot sinθ + (1/2)gt2 + C'
where C' is the value of y at x = 0.
y/H = A(x/H)2 + B(x/H) + C
where
A = gh/(2vo2cos2θ)
B = - tanθ
C = C'/H
y/H = A(x/H)2 + B(x/H) + C + D
where:
D = T/H
A = -0.425 + 0.25(hv/H)
B = 0.411 - 1.603(hv/H) - [1.568(hv/H)2 - 0.892(hv/H) + 0.127]1/2
C = 0.150 - 0.45(hv/H)
D = 0.57 - 0.02(10m)2e10m
in which
m = (hv/H) - 0.208 and
hv = velocity head of the approach flow.
A= -0.425 B= 0.055 C= 0.150 D= 0.559.
Q = CLH1.5
|
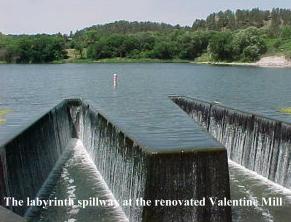 Valentine Mill Pond, Valentine, Nebraska. |
 Valentine Mill Pond, Valentine, Nebraska. |
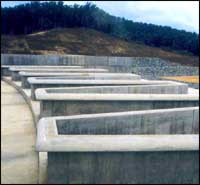
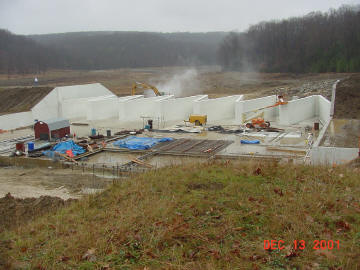 Cloe Lake spillway, Pennsylvania. |
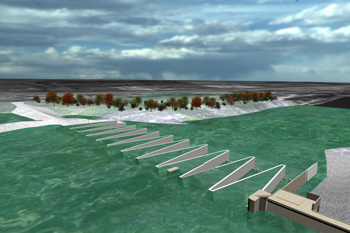
 Melaka, Malaysia. |
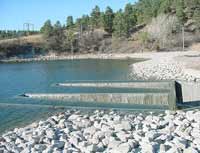
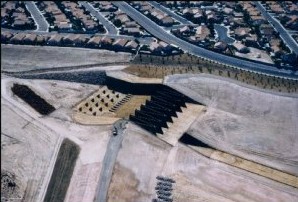 Lower Las Vegas Wash detention basin, Nevada. |
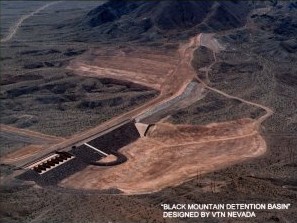 Black Mountain detention basin, Las Vegas, Nevada. |
 Proposed Lake Brazos Dam, Waco, Texas. |
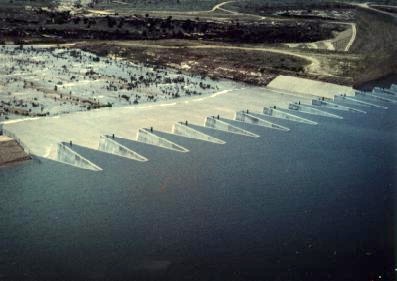 Ute Dam, New Mexico. |
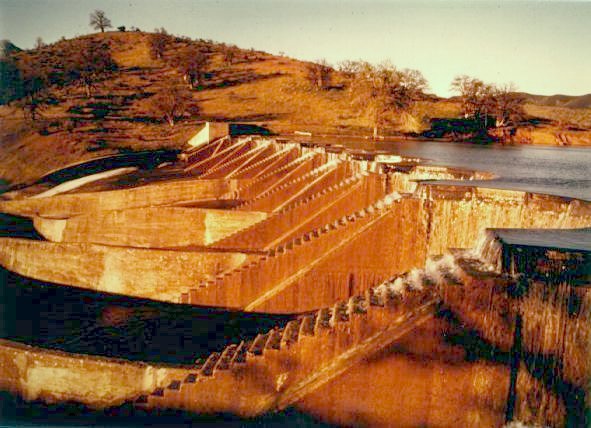 East Park Dam, California. |
|
C = 3.27 + 0.4 (H/h)
where h= height of the weir.
C = 5.68[1 + (h/H)]1.5
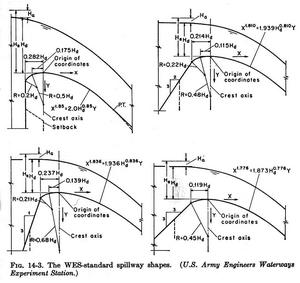
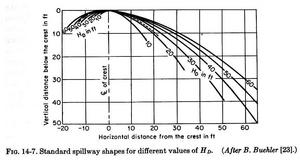
Xn = KHdn-1Y
X and Y are the coordinates of the crest profile, with the origin at the highest point of the crest.
Hd is the design head excluding the velocity head of the approach flow.
K and n are parameters depending on the slope of the upstream face.
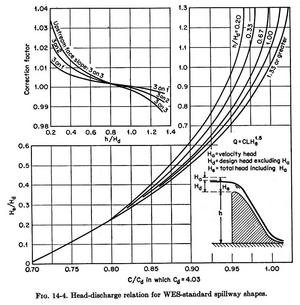
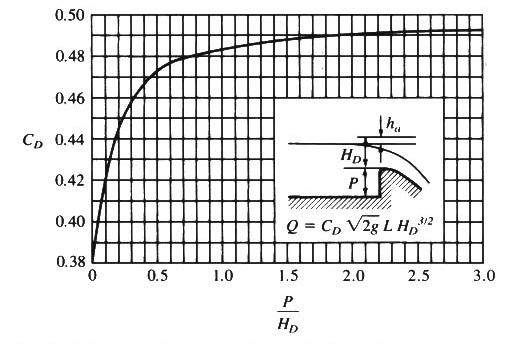
Q = CLHe1.5
where He is the total energy head of the crest, including the velocity head in the approach channel.
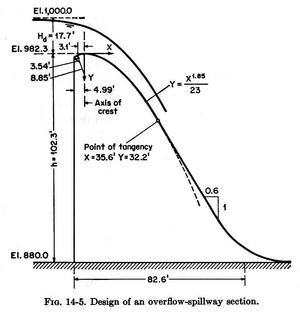
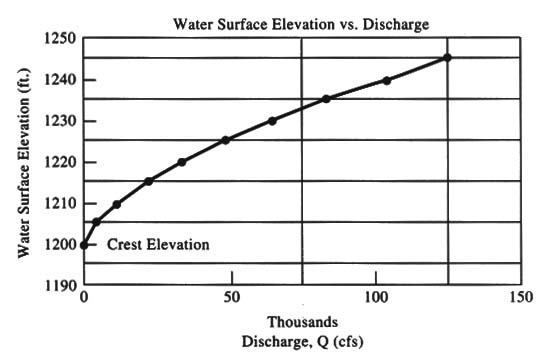
Example 14-1.- Determine the crest elevation and the shape of an overflow spillway section having a vertical upstream face and crest length L = 250 ft.
The design discharge is 75,000 cfs. The upstream water surface at design discharge is at Elev. 1000, and the channel floor is at Elev. 880 ft.
Solution.-
Q = CdLHe1.5
75000 = 4.03 × 250 × He1.5
He = 17.8 ft.
Va = Q/[L × (h + Hd)] = 75000/(250 × 120) = 2.5 fps.
Ha = Va2/(2g) = 0.1 ft.
Hd = He - Ha = 17.8 - 0.1 = 17.7 ft.
h = 120 - 17.7 = 102.3 ft.
Assumption in Step 1 was correct.
1000 - 17.7 = 982.3 ft.
Xn = K Hdn-1 Y
Y = Xn/(K Hdn-1)
Y = X1.85/(2 Hd0.85)
Y = X1.85/(2 × 17.70.85)
Y = X1.85/23.
Y' = (1.85/23) X0.85
Y' = 0.08 X0.85
Y' = ΔY /ΔX = 1.0/0.6
1.0/0.6 = 0.08 X0.85
X = 35.6 ft.
Y = X1.85/23 = 32.2 ft.
0.5 Hd = 8.8 ft.
0.2 Hd = 3.5 ft.
0.282 Hd = 5.0 ft.
0.175 Hd = 3.1 ft.
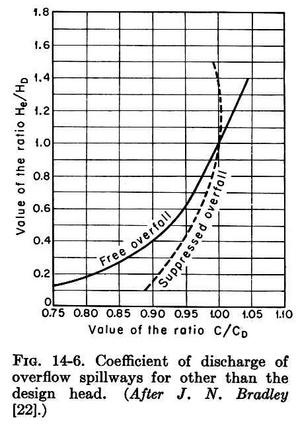
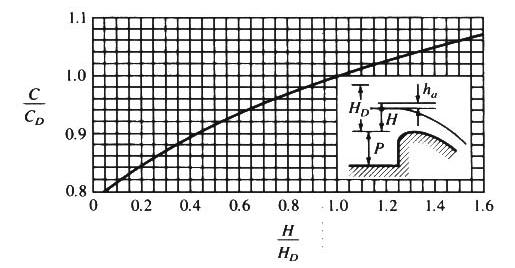
C = 3.97 (He/HD )0.12
He is the operating head.
HD is the design head including the approach velocity for a vertical-face spillway.
Check with ONLINE OGEE RATING.
Go to Chapter 15.
|