CIV E 445 - APPLIED HYDROLOGY
SPRING 2014
LAB No. 9
Use the data of Problem 7-2 in the text (page 249) to solve for the correlation coefficient of the joint distribution of quarterly flows. For this purpose, use ONLINE TWOD CORRELATION. Report rx,y.
Use the data of Problem 7-7 in the text (page 250) to solve the multiple linear regression problem online. For this purpose, use ONLINE REGRESSION 13. Report α, β1 and β2. What is the predicted value for time of concentration (minutes), given hydraulic length L = 2384 m, and catchment slope S = 0.0011 (m/m)?
What is the likely range in peak flood discharge for the Oroville dam, given the drainage area of 3,607 sq mi? Use CREAGER. Is the Oroville Dam spillway system (service and emergency spillways) adequately sized for the worst case?
Service spillway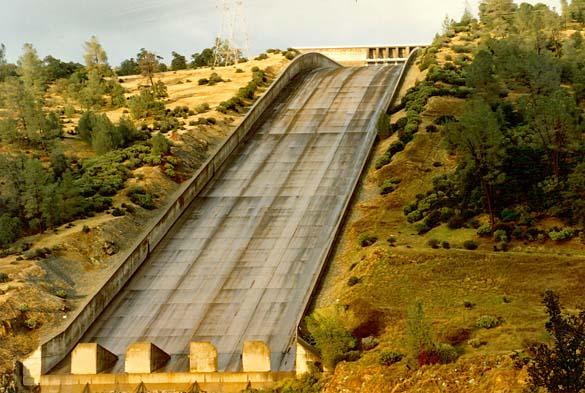
Emergency spillway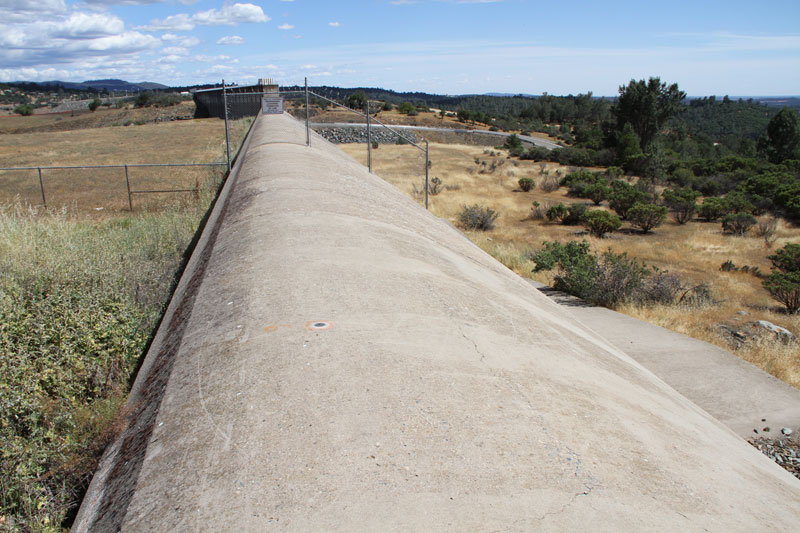
Calculate the 100-yr flood for Los Peñasquitos Creek near Poway, California (USGS station 11023340) using online_usgs_floods_california. Compare the results from the 1977 and 2012 USGS flood-frequency reports.
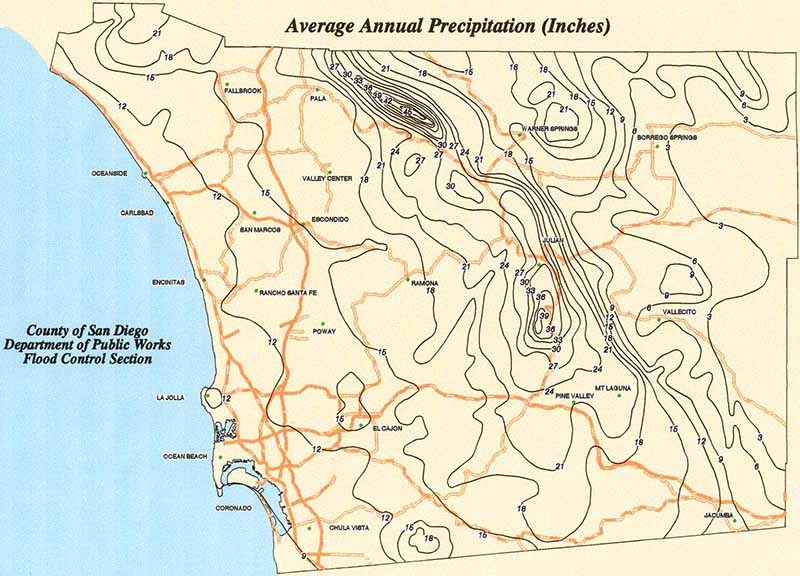
Average annual precipitation in San Diego County.