1.10
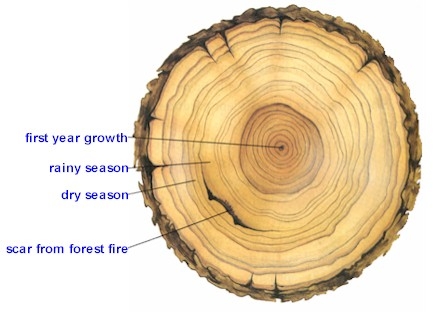
The probability of periods of dry years, or droughts, must be considered in water resources planning.
1.11
Long-term records show a tendency for dry years to group together.
1.12
This indicates that the sequence of dry years is not random, with dry years tending to follow other dry years.
1.13
It is therefore necessary to consider both the severity and duration of a drought period.
1.14
The severity of droughts can be established by measuring
(1) the deficiency in rainfall and runoff,
(2) the decline of soil moisture, and
(3) the decrease in groundwater levels.
1.15
Alternatively, low-flow frequency analysis can be used in the assessment of the probability of droughts of different severities and
durations.
2. LOW-FLOW FREQUENCY
2.01
Low-flow frequency analysis begins with the identification of the low-flow series.
2.02
Either the annual minima or the annual exceedence series are applicable.
2.03
In a monthly analysis, the annual minima series is formed by the lowest monthly flow volumes in each year of record.
2.04
In the annual exceedence method, the lowest monthly flow volumes in the record are selected, regardless of when they occurred.
2.05
In the latter method, the number of values in the series need not be equal to the years of record.
2.06
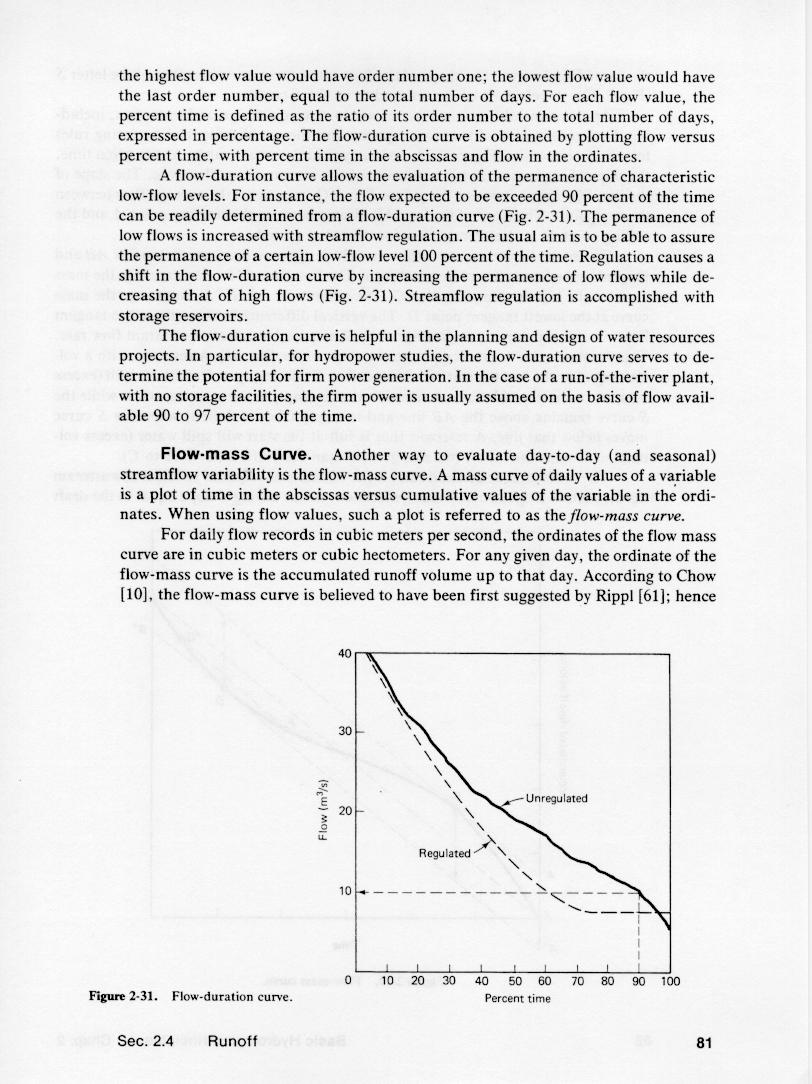
A flow-duration curve is a plot of ranked values of daily discharge, from high to low, for a given period, with percent time in the abscissas,
as shown here.
2.07

2.08
The severity of low flows can be depicted with a flow-duration curve.
2.09
However, such a curve does not contain information on the sequence of low flows
or the duration of possible droughts.
2.10
The analysis is made more meaningful by abstracting the minimum flows over a period of several consecutive days.
2.11
For instance, for each year, the 7-day period with minimum flow is abstracted, and the minimum flow is the average for that period.
2.12
A frequency analysis of the low-flow series results in a function describing the probability of occurrence of low flows
of a certain duration.
2.13
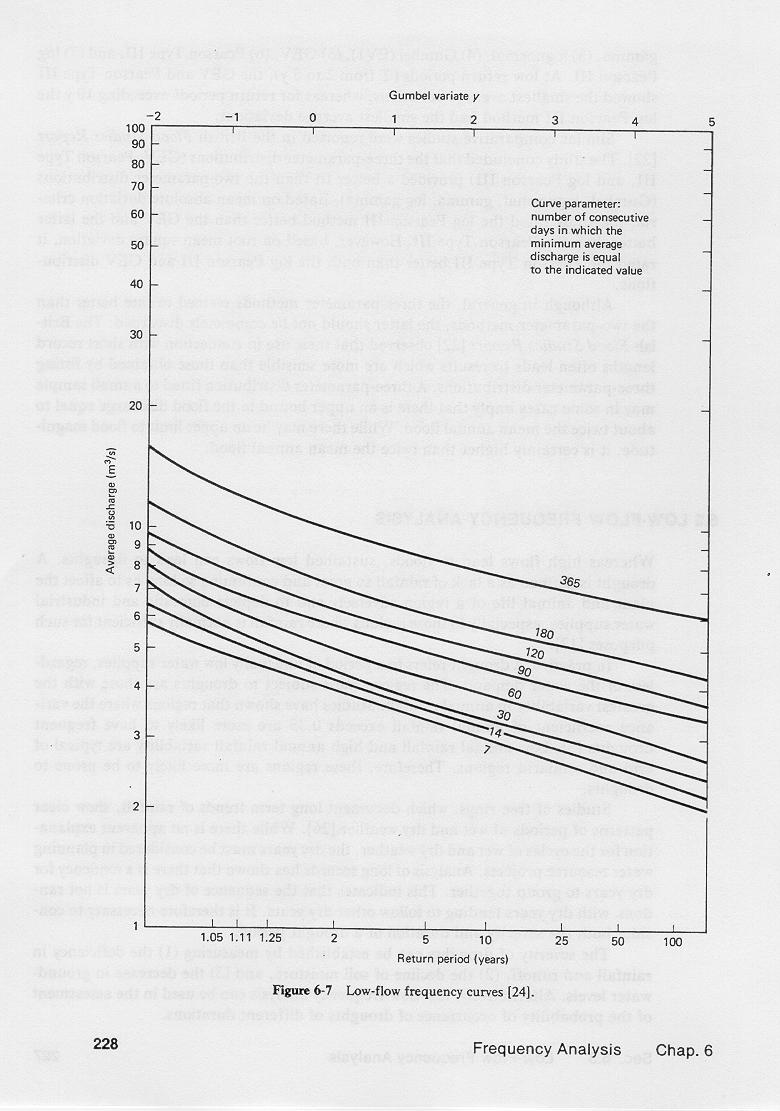
The same analysis repeated for other durations leads to a family of curves depicting low-flow frequency, as shown in this figure.
2.14

2.15
This figure shows the average minimum discharge to be expected for return period, in years, in the abscissas,
and indicated durations, in consecutive days, in the curve parameter.
2.16
For example, an average minimum discharge of 4 m3/s and duration of 7 days is expected every 2 years.
2.17
Likewise, an average minimum discharge of 3 m3/s and duration of 30 days is expected every 25 years.
3. STREAMFLOW REGULATION
3.01
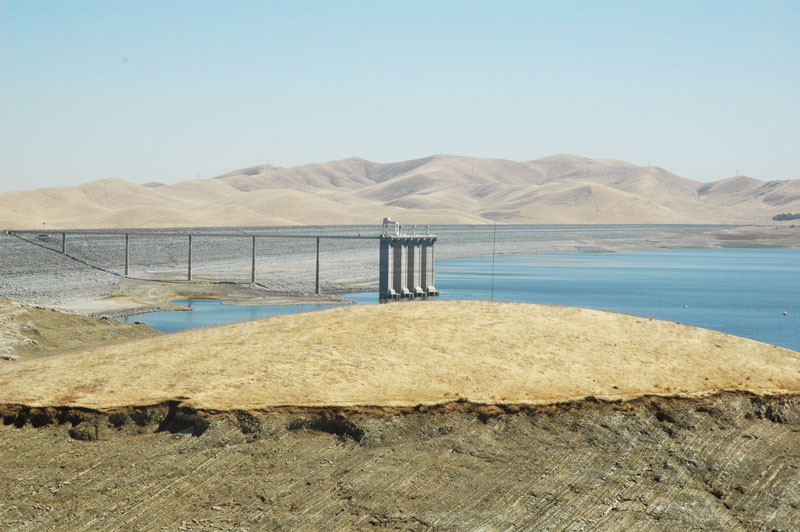
Streamflow regulation with dams may be necessary to provide a minimum downstream flow
for specific purposes.
3.02
The reservoirs serve as the mechanism to diffuse the natural flow variability into downstream flows which
have lesser variability.
3.03
Regulation is often necessary for downstream low-flow maintenance, usually for the purpose of meeting
agricultural, municipal, and industrial water demands, minimum instream flows for fisheries and wildlife conservation,
navigation draft, and water pollution control.
Narrator: Victor M. Ponce
Music: Fernando Oñate
Editor: Flor Pérez
Copyright © 2011
Visualab Productions
All rights reserved


