|
ENGINEERING HYDROLOGY: CHAPTER 042 - RATIONAL METHOD 2
1. THEORY
1.1 Runoff concentration
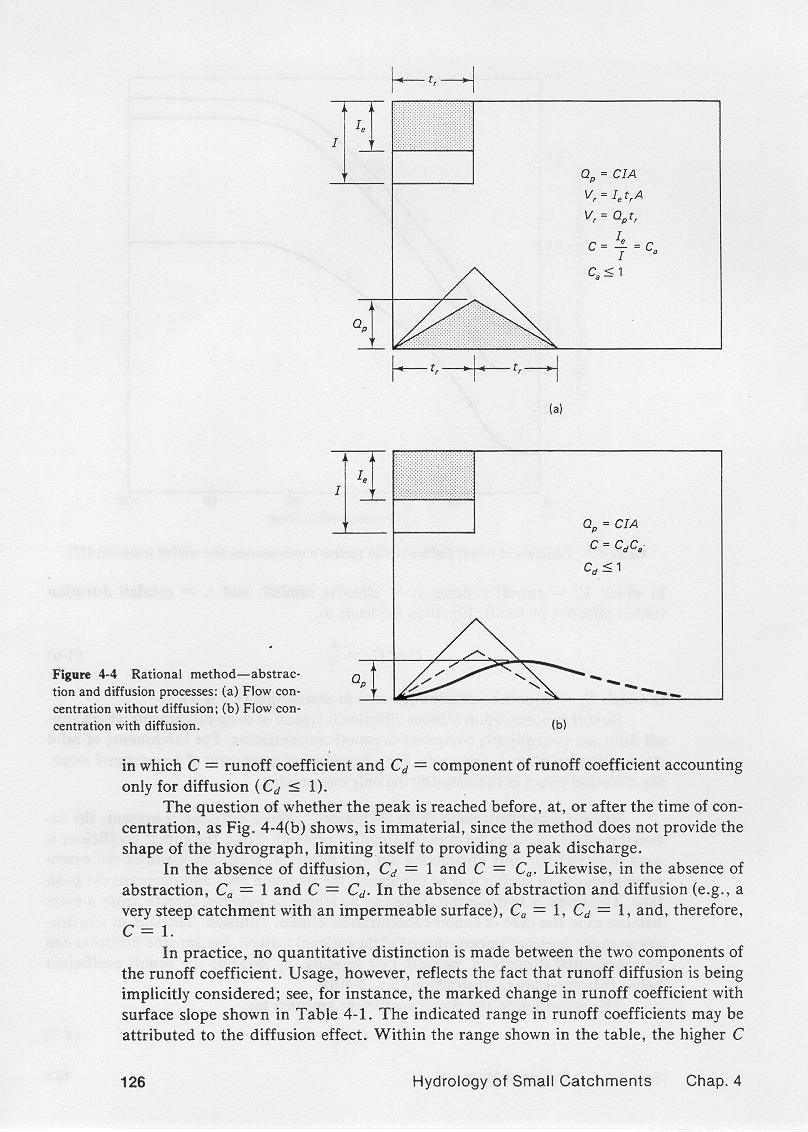
In the absence of diffusion, a catchment concentrates the flow at the outlet,
attaining the maximum possible flow at a time equal to the time of concentration.
1.2
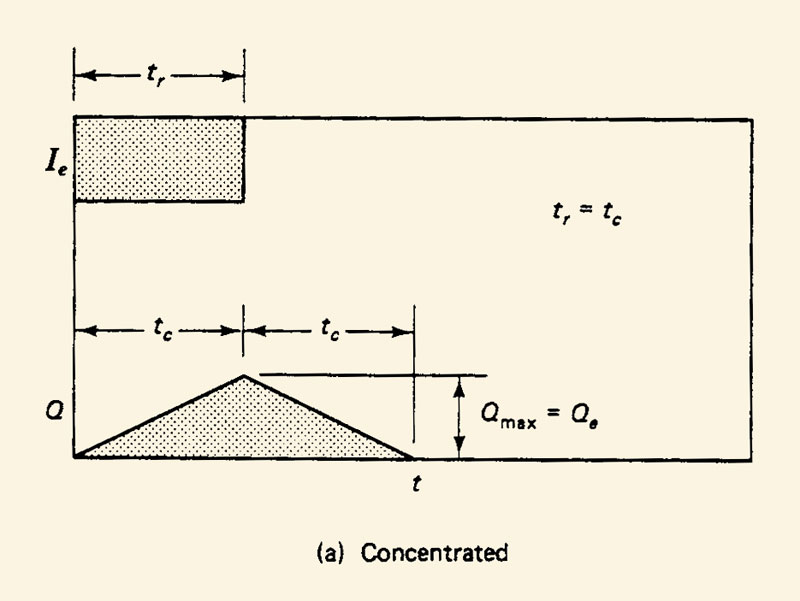
For rainfall duration equal to the time of concentration, concentrated catchment flow is obtained at the outlet.
1.3
Since there is no diffusion, the method gives not only a peak flow but also a hydrograph in the shape
of a isosceles triangle, with recession time equal to rising time.
1.4
The runoff coefficient is the ratio of effective rainfall to total rainfall.
1.5
A mass balance of effective rainfall and runoff leads to an expression for runoff volume Vr:
1.6
1.7
from which the abstraction-only runoff coefficient is:
1.8
1.9
In the absence of runoff diffusion, this runoff coefficient accounts only for hydrologic abstractions,
with a maximum value equal to one.
1.10 Runoff diffusion
When diffusion is present, it may be accounted for by reducing the runoff coefficient below the abstraction-only value.
1.11
This situation is applicable in catchments of very mild slope, say, less than 0.0001.
1.12
Diffusion increases the recession time and reduces the peak flow.
1.13
Thus, a hydrograph cannot be obtained solely from the mass balance.
1.14
The reduction in runoff coefficient to account for diffusion leads to:
1.15
1.16
where Cd is less than 1.
1.17
In practice, seldom is a quantitative distinction made between the two components of the runoff coefficient.
1.18
For small catchments, runoff diffusion is usually negligible, leading to Cd = 1 and C = Ca.
1.19
2. APPLICATIONS
2.1 Runoff coefficient and φ-index
The runoff coefficient can be related to total rainfall intensity and φ-index, assuming
1. diffusion is negligible.
2. total and effective rainfall are constant in time.
2.2
The first assumption is valid for small catchments.
2.3
The second assumption is implicit in the rational method.
2.4
For catchment response without diffusion:
2.5
2.6
For constant rainfall intensities:
2.7
2.8
Combining these two equations leads to:
2.9
2.10
Solving for φ:
2.11
2.12 Aerial weighing of runoff coefficients
The values of runoff coefficient may vary within a catchment.
2.13
When a clear pattern of variation is apparent, a weighted value is applicable.
2.14
Individual subareas are delineated, and their respective runoff coefficients identified.
2.15
Aerial weighing leads to:
2.16
2.17
in which rainfall intensity is in millimeters per hour, area in square kilometers, and peak discharge in cubic meters per second.
2.18 Composite catchments
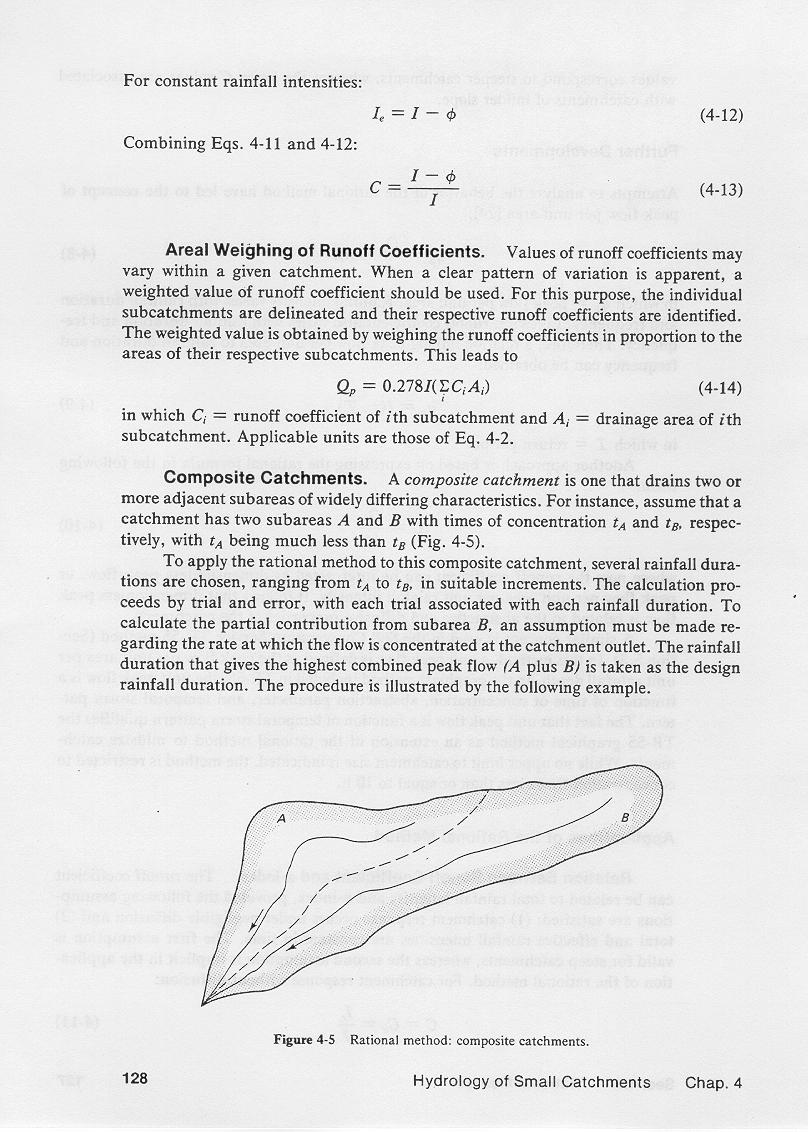
A composite catchment drains two or more adjacent subareas of widely differing characteristics.
2.19
2.20
Assume two subareas A and B, with times of concentration tA and tB, respectively, where tA is substantially less than tB.
2.21
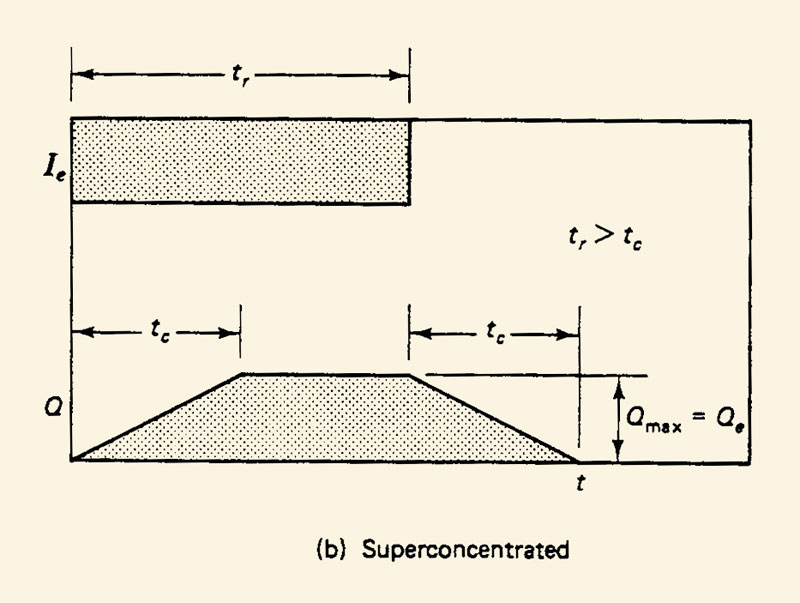
Subarea A has the shorter time of concentration; therefore, concentrated or superconcentrated flow is assumed to start.
2.22
2.23
2.24
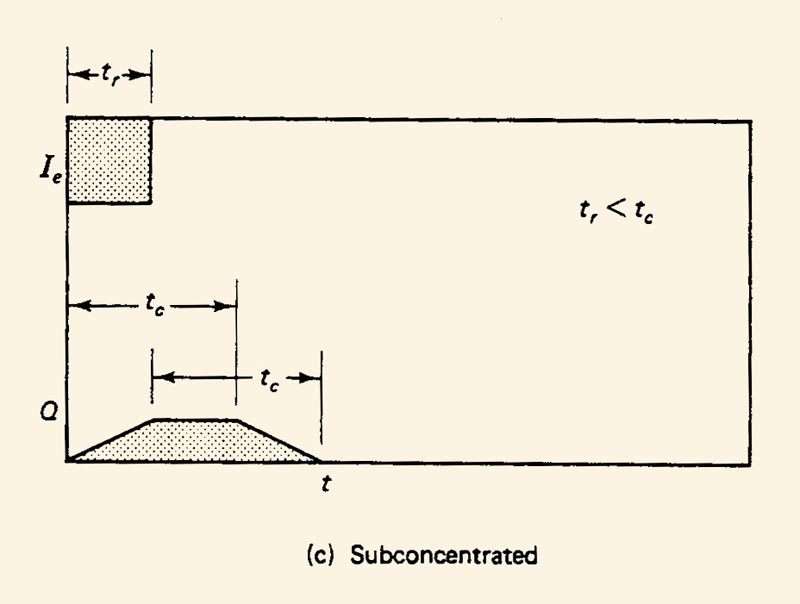
Subarea B has the longer time of concentration; therefore, subconcentrated flow is assumed.
2.25
2.26
An assumption of linear concentration at the catchment outlet of subarea B is usually appropriate.
2.27
Several rainfall durations tr, ranging from tr = tA to tr = tB, are tried.
2.28
The duration that gives the highest peak is the design duration.
2.29 Effect of catchment shape
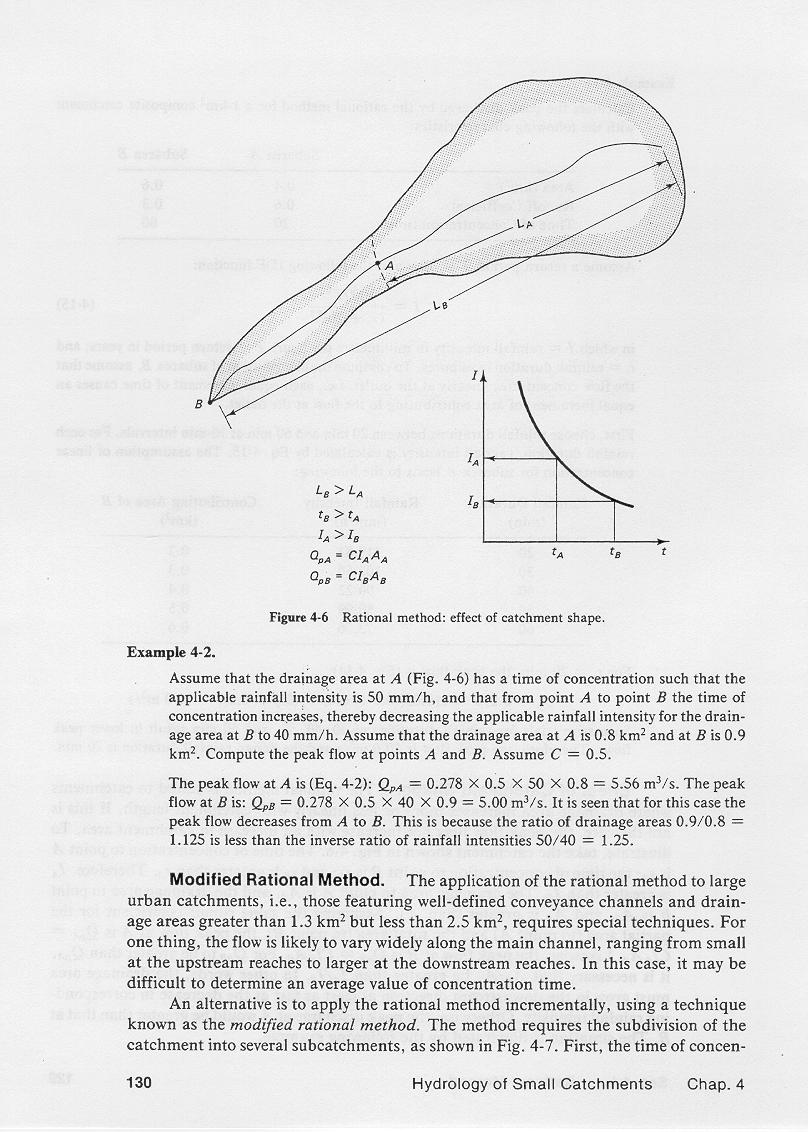
The rational method is suited to catchments where drainage area increases more or less linearly with catchment length.
2.30
If this is not the case, the peak flow may not increase with catchment area.
2.31
For the peak flow not to decrease in the downstream direction, the drainage area must grow at least
as fast as the decrease in rainfall intensity.
2.32
2.33
For example, assume that the drainage area at A is 0.8 square kilometers, and the rainfall intensity, based on the time of concentration, is
50 mm/hr.
2.34
Assume that the drainage area at B is 0.9 square kilometers, and the rainfall intensity is 40 mm/hr.
2.35
Further assume a runoff coefficient C= 0.5.
2.36
The peak flow at A is:
2.37
| Qp =
0.278 (0.5) (50) (0.8)
Qp = 5.56 m3/s | |
|
2.38
The peak flow at B is:
2.39
| Qp =
0.278 (0.5) (40) (0.9)
Qp =
5.00 m3/s | |
|
2.40
In this case, the peak flow decreased from A to B.
2.37
This is because the product of rainfall intensity times drainage area actually decreased in the downstream direction.
Narrator: Victor M. Ponce
Music: Fernando Oñate
Editor: Flor Pérez
Copyright © 2010
Visualab Productions
All rights reserved
| 


