|
Ecohydroclimatological research
along the Catacocha-Zamora transect,Loja and Zamora-Chinchipe, Ecuador
25 September 2015
|
|
ABSTRACT
This study reports on continuing ecohydroclimatological research along the
Catacocha-Zamora transect in the provinces of Loja and Zamora-Chinchipe,
Ecuador. Mean annual precipitation varies between 400 mm in Catamayo,
along the study transect, to 2200 mm in Zamora, to the eastern limit. Altitudinal variations are also
marked, between 1230 m in Catamayo, to 2930 m in Cerro del Consuelo, to 900 m in Zamora.
Ecohydrological and hydroclimatological
data are examined with the aim of
developing relations to underpin the nascent field of ecohydroclimatology.
Applications are envisioned in the
management of tropical montane ecosystems.
|
1. INTRODUCTION
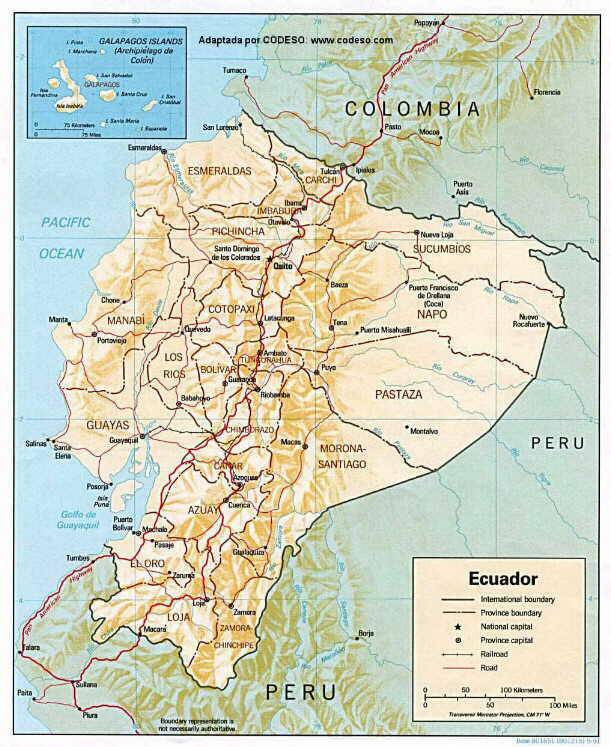
Ecuador is endowed by Nature with unmatched ecological diversity. This is
due to: (1) its geographical location along the Equator,
(2) its relative continental position next to the Pacific Ocean,
and (3) the presence of the Andes Mountain Range,
which crosses the middle of the country from North to South (Fig. 1).
This unusual combination of near-zero latitude, proximity to a very large moisture source,
and wide altitudinal range
is responsible for a substantial ecological and biological diversity. Therefore, the region constitutes a veritable field laboratory for the
study of tropical ecological, hydrological, and climatological relations.
|
Fig. 1
Map of Ecuador, showing Andes Mountain Range passing through the middle.
(Click --here01-- to expand).
|
|
This study focuses on the southern provinces of Loja and Zamora-Chinchipe (Fig. 1). These regions feature
marked gradients in mean annual precipitation within a relatively
short distance.
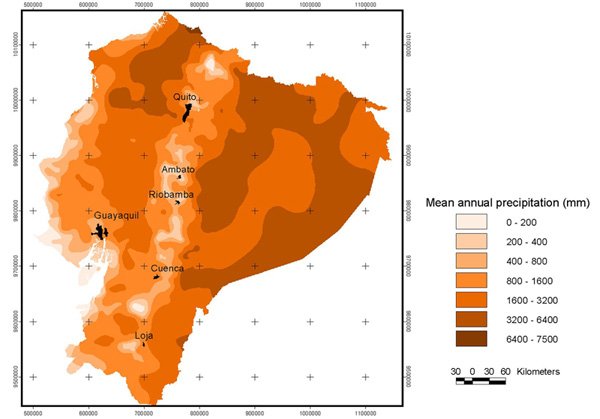
Figure 2 shows
mean annual precipitation in Loja and Zamora-Chinchipe,
varying between
200-400 mm in Loja to 3200-6400 mm in Zamora-Chinchipe.
Thus, a transect of relatively limited length transversing these two provinces
is appropriate for the study of ecohydroclimatological relations.
|
Fig. 2
Mean annual precipitation in Ecuador (Click --here02-- to expand).
|
|
This study is part of a research program in
ecohydroclimatology carried out jointly by San Diego State University (San Diego,
California, USA) and the Technical
University of Loja (Loja, Ecuador).
The logistical support for the field studies was provided by the
Technical University of Loja.
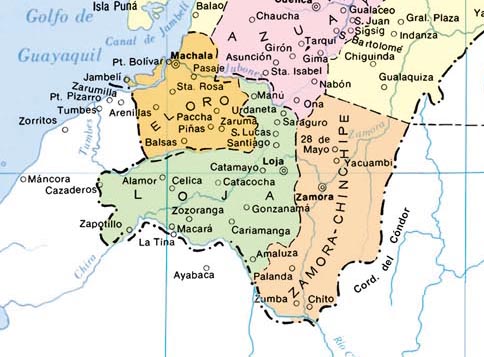
2. GEOGRAPHICAL SETTING
The provinces of Loja and Zamora are located in southern Ecuador (Fig. 3).
Wolf (1892) has
described the geology, geomorphology, and hydrography of Ecuador, including
Loja and Zamora. The Andes Mountain Range transverses the study region,
from the Sabanilla Knot, to the south of Loja,
to the moorlands of Zaraguro, toward the north.
From the Sabanilla Knot, the Santa Rosa Range takes off to the northwest
and the Condor Range to the
southeast.
The Santa Rosa Range is narrow, low, and relatively small. From
the Condor Range,
several large branches take off toward the northeast.
|
Fig. 3
Location of Loja and Zamora-Chinchipe in southern Ecuador
(Click --here03-- to expand).
|
|
From 4° 8' S latitude, south of the city of Loja, the Western Range runs parallel to the Eastern Range
in a general northern direction.
The Western Range is narrow, with short branches on both sides, rising up to 3000 m through most of its length.
In contrast, the Eastern Range rises up to 4000 m. These two branches of the Andes
are united by two transversal knots, the Cajanuma Knot to the south of Loja (Fig. 4), and the Guagra-uma Knot to the north.
The region comprised between the knots constitutes the valley of Loja.
|
Fig. 4
The Cajanuma Knot at close range.
|
|
The valley of Loja, oriented from north to south, is divided into two different sections.
The northern section is narrow, resembling a canyon. The southern section, properly the valley of Loja,
is oval-shaped, with a total length comprising about 6
km and a maximum width of about 3 km.
The Malacatos river has its headwaters in the Cajanuma Knot, flowing north to meet
the Zamora river at Loja proper, where it takes the name of the latter.
Continuing to flow north through the Guagra-uma Knot, the Zamora river meets
several tributaries along its course, eventually discharging into the Santiago river
in the eastern lowlands of Zamora-Chinchipe province.
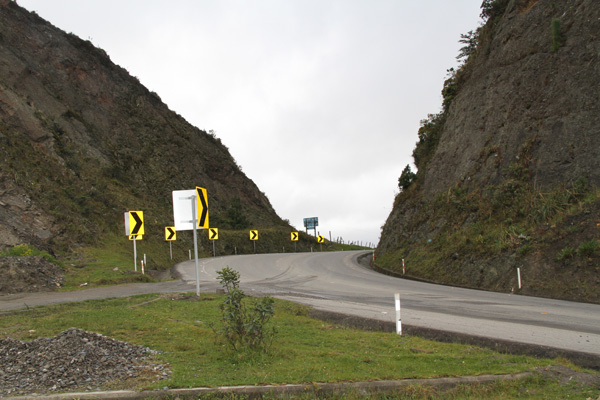
The interandean valley of Loja is small and low, at 2150 m altitud, with the city of Loja
occupying the entire valley. The lowest point on the road (pass) from Loja through Cajanuma Knot
to the south is at 2525 m altitude (Fig. 5).
The lowest point on the road from Loja to Catamayo to the west is at 2786 m (Fig. 6).
This pass is next to Villonaco peak, which rises to about 3000 (Wolf 1892).
|
Fig. 5
The lowest point on the road (pass) from Loja to Malacatos.
|
|
|
Fig. 6
The lowest point on the road (pass) from Loja to Catamayo.
|
|
3. CONCEPTUAL FRAMEWORK
This study sets the foundations to
describe the characteristics of
vegetative communities, using the interdisciplinary perspective of ecohydroclimatology.
Several factors condition the type and density of vegetative communities across the landscape.
The most important are:
Mean annual precipitation
Mean
annual precipitation determines the humidity provinces
(arid, semiarid, subhumid, or humid) (Holdridge 1947).
Plants respond readily to the presence of environmental moisture, including that in the air,
land surface, vadose zone (unsaturated soil), and that flowing underground.
Low relative humidity in the air is usually associated
with low moisture levels on land surface and soil,
together with the presence of ephemeral streams and relatively
deep groundwater.
Conversely, high relative humidity is usually associated with high moisture levels on the land surface
and soil, coupled with perennial streams and shallow groundwater. In practice,
these elements of the landscape are all related, with a common denominator:
high environmental moisture means humid, while low moisture means arid.
Terrain geology and geomorphology
Next to climate type, terrain geology and geomorphology
are generally a good indicator of vegetation type
(Cole 1960a;
Ponce and da Cunha 1993). Notwithstanding other factors,
terrain geology and geomorphology determine the relation between surface water and groundwater.
Plants may transpire either vadose water, groundwater,
or both (Ponce 2006).
Land surface slope and rock/soil type determine the quantity of surface flow, surface detention and
retention,
infiltration rate, depth to water table, and groundwater replenishment.
In addition, drainage conditions, either exorheic, endorheic, or mixed exorheic-endorheic,
by interacting with soil and groundwater salinity,
determine the type and density of vegetative communities that prevail across the landscape.
Proximity to groundwater
Vegetative communities referred to as
phreatophytes specialize in satisfying their water needs directly from the
underlying groundwater. In essence, shallow groundwater supports the growth of plants
that habitually feed on groundwater (Meinzer 1927). Thus,
the presence of phreatophytes is a good indicator of shallow
groundwater in the vicinity.
Speed of surface drainage
Land slopes vary widely, from
larger than 30% in certain mountainous landscapes (Ponce, 2008), to near zero
in some geologically controlled depositional landscapes or broad river valleys undergoing
geologic subsidence (Ponce 1995). Very mild terrain slopes lead to swamps and
wetlands and their characteristic vegetative community structures,
including the dynamics imposed by seasonal variations, floods and droughts, and more recently, anthropogenic climate change.
Mean annual temperature
Plants are naturally adapted to either wide (desert)
or narrow (rainforest) variations in temperature. Mean annual temperature
conditions the liveability and survivability of diverse vegetative
communities across the landscape, from arid to humid.
Seasonal variations in temperature
Plants are naturally adapted to seasonal
variations in temperature, which are conditioned by latitude, altitude, and
continental
location relative to the nearest moisture source.
Desert plants readily adapt to wide variations in seasonal temperature, while rainforest plants do not.
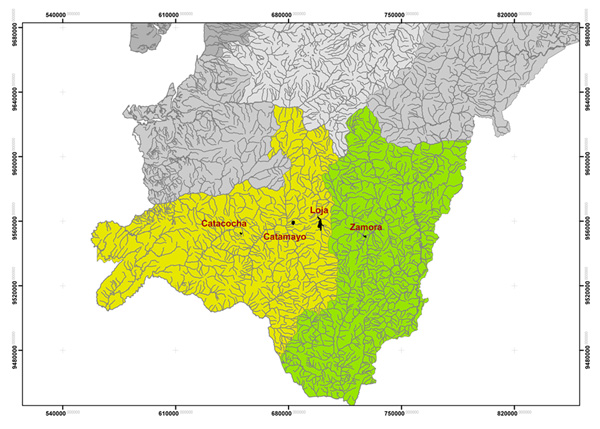
4. ANNUAL PRECIPITATION
The transect chosen for this study comprises the section
between Catacocha, in central Loja province,
to Zamora, in western Zamora-Chinchipe (Fig. 7).
|
Fig. 7
General location of the study transect in the Loja and Zamora-Chinchipe provinces.
(Click --here04-- to expand).
|
|
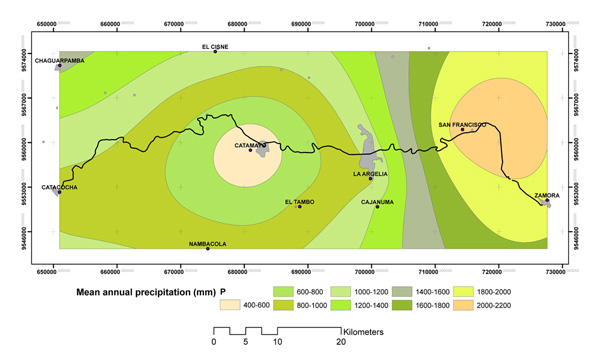
Figure 8 shows a map of mean annual precipitation
for the study transect. Data from ten (10) climatological stations were used to develop
this map. The stations are, from west to east: (1) Chaguarpamba, (2) Catacocha,
(3) Nambacola, (4) El Cisne, (5)
Catamayo, (6) El Tambo, (7) La Argelia (in Loja), (8) Cajanuma, (9) San Francisco, and (10) Zamora.
The locations of the stations are shown in Fig. 8.
|
Fig. 8
Mean annual precipitation isohyets for the Catacocha-Zamora transect.
(Click --here05-- to expand).
|
|
Mean annual precipitation varies from
400 mm in Catamayo to 2200 mm in San Francisco, depicting a marked precipitation gradient.
The straight distance between Catamayo and San Francisco is about 40 km, while
the straight distance between Catacocha and Zamora is about 80 km.
Significantly, the city of Loja, capital of the province of Loja,
is located at midrange along the
Catamayo-San Francisco subtransect.
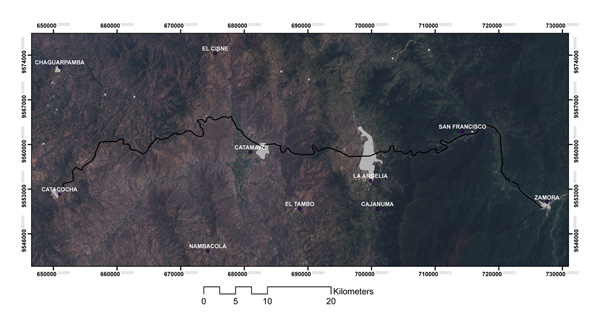
Figure 9 shows an image of the Catacocha-Zamora transect, revealing the marked diferences
in vegetation along the transect. Albedo,
a reliable indicator of the presence or absence of
vegetation
is estimated to vary between as high as 0.30 near Catamayo, to as low as
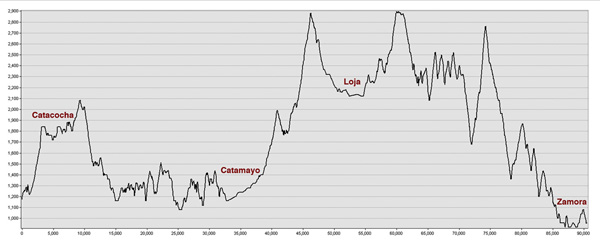
0.05 near San Francisco (Ponce et al. 1997). Figure 10 shows a longitudinal
profile of the Catacocha-Zamora transect, corresponding to Fig. 9.
The Catacocha, Catamayo, Loja, and Zamora valleys are indicated in the profile.
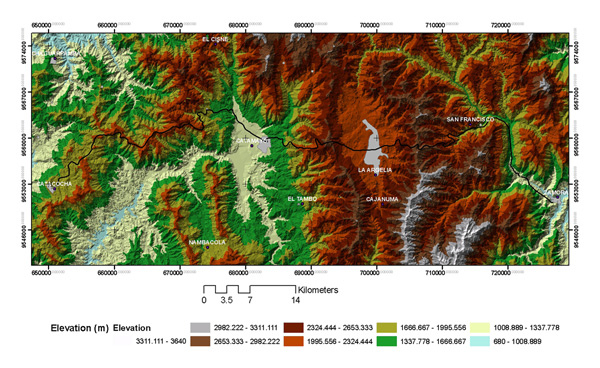
Figure 11 shows a topographic map comprising the study transect.
|
Fig. 9
Image of the Catacocha-Zamora transect
(Click --here06-- to expand).
|
|
|
Fig. 10
Longitudinal profile of Catacocha-Zamora transect
(Click --here07-- to expand).
|
|
|
Fig. 11
Topographic map comprising the Catacocha-Zamora transect
(Click --here08-- to expand).
|
|
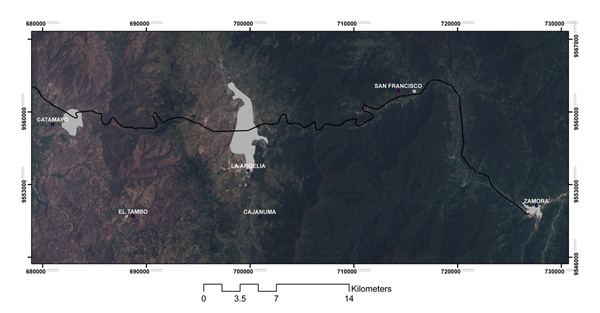
Figure 12 shows an image of the Catamayo-Zamora transect, at somewhat
larger scale that the previous image,
again revealing the marked diferences
in vegetation type and density along the transect.
Pulgar et al. (2010) have noted
that mean annual precipitation at an isolated spot at Cerro El Consuelo, near San Francisco,
has been measured at 6,259 mm.
Also, they have documented
the number of rainy months to vary from 1-2 for Catamayo (a hyperarid climate)
to 11-12 for San Francisco (a hyperhumid climate) (Ponce et al. 2000).
Thus, the Catamayo-San Francisco
subtransect appears to be optimal for the study of tropical ecohydroclimatological relations.
|
Fig. 12
Image of the Catamayo-Zamora transect
(Click --here09-- to expand).
|
|
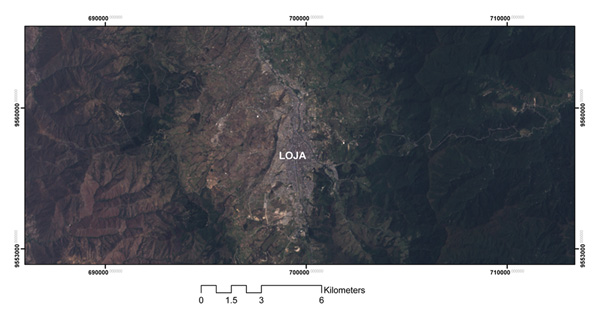
Figure 13 shows an image focused on the Loja valley, showing the marked differences
in vegetation density from the mountains west of Loja to those east of Loja, a distance of less than 20 km.
Mean annual precipitation (Fig. 8) varies from 800-1000 mm to the west and 1600-1800 mm to the east.
|
Fig. 13
Image of the vicinity of Loja
(Click --here10-- to expand).
|
|
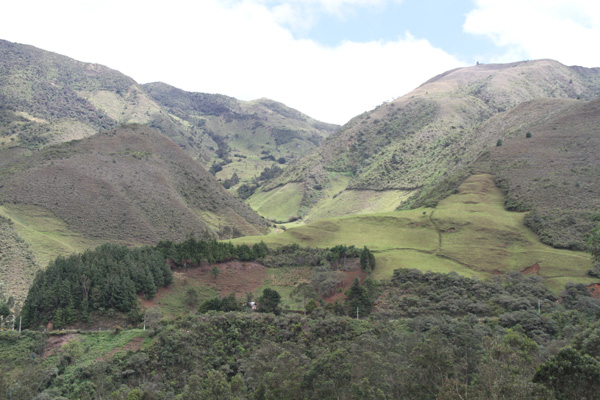
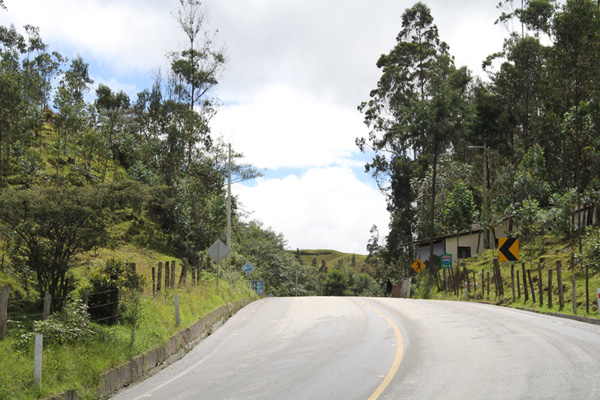
5. VEGETATIVE LANDSCAPES
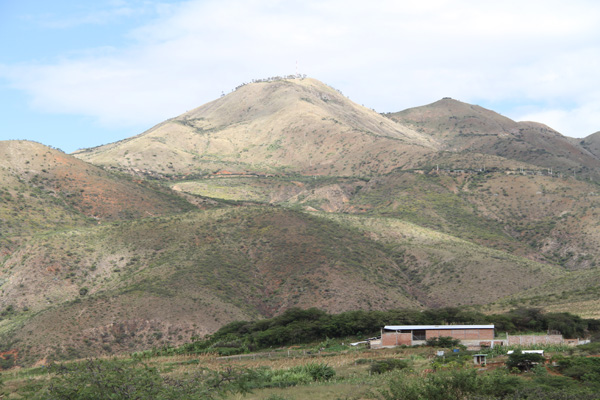
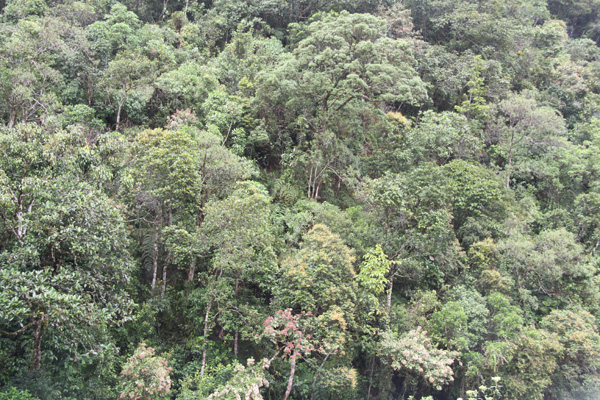
Figures 14 and 15 show the contrast between
typical landscapes and associated vegetative communities in Catamayo and Zamora, respectively.
Figure 14 shows a hilly landscape covered with short
semiarid shrubs and grasses, while Fig. 15 shows a dense tropical montane
humid forest, featuring relatively tall trees.
Ongoing field research is aimed at identifying the spatial distribution, density, size, and other relevant
characteristics of vegetative species and communities
along the study transect.
|
Fig. 14
Mountainous semiarid landscape in the vicinity of Catamayo, Loja province.
|
|
|
Fig. 15
Vegetative communities along the road to Zamora, Zamora-Chinchipe province.
|
|
6. BIOCLIMATOLOGICAL INDEXES
Three indexes are used to study bioclimatological relations (Rivas-Martínez 2007):
- Continentality index
This index is equal to the average temperature of the hottest month Thot minus the average
temperature of the coldest month Tcold .
Ic = Thot - Tcold
The following procedure is used to calculate Thot :
The maximum daily temperature, for each month and year of record
is identified, and the mean maximum monthly temperature is calculated.
The mean of the mean maximum monthly temperature
is calculated for the entire record.
The month with the highest mean of
the mean maximum monthly temperature is selected as the hottest month.
A similar procedure is applied to calculate Tcold.
The continentality index varies between Ic = 0 for an extreme oceanic influence,
to Ic = 65 for an extreme continental influence.
- Thermicity index
This index is equal to the mean annual temperature Tmean
plus the mean of the monthly minimum temperatures Tmin
plus the mean of the monthly maximum temperatures Tmax. The sum is multiplied by 10.
It = 10 (Tmean + Tmin + Tmax)
The mean annual temperature is the mean of the (12) mean monthly average temperatures.
The mean of the monthly minimum temperatures in the mean of the (12) mean monthly minimum temperatures.
The mean of the monthly maximum temperatures in the mean of the (12) mean monthly maximum temperatures.
- Positive temperature index
This index is equal to the sum of all positive (nonnegative) mean monthly temperatures. The sum is multiplied by 10.
Tp = 10 ( ∑ Tpos )
Table 1 shows the classification of climates as a function of the continentality index.
Table 2 shows the classification of climates as a function of the thermicity and positive temperature indexes.
Table 3 shows the indexes calculated for the following stations: (1) Catacocha, (2) Catamayo,
(3) La Argelia, and (4) Zamora.
Table 4 shows the climatic classification for the stations considered in this study.
Table 1. Classification of climates based on continentality index.
| Types |
Continentality index Ic |
| Hyperoceanic |
0 - 11 |
| Oceanic |
11 - 21 |
| Continental |
> 21 |
|
Table 2. Classification of climates based on thermicity
and positive temperature indexes.
| Type of climate |
Thermicity index It |
Positive temperature index Tp |
| Infratropical |
710 - 890 |
2900 - 3700 |
| Thermotropical |
490 - 710 |
2300 - 2900 |
| Mesotropical |
320 - 490 |
1700 - 2300 |
| Supratropical |
160 - 320 |
950 - 1700 |
| Orotropical |
120 - 160 |
450 - 950 |
| Criorotropical |
|
225 - 450 |
|
Table 3. Bioclimatological indexes for stations in the study region.
| Description\ Station |
Catacocha |
Catamayo |
La Argelia |
Zamora |
| Elevation (m) |
1840 |
1230 |
2160 |
970 |
| Latitude (South) |
4° 03' 07" |
3° 59' 34" |
4° 02' 11" |
4° 05' 37" |
| Longitude (West) |
79° 38' 29" |
79° 22' 15" |
79° 12' 04" |
78° 57' 00" |
| Record length (yr) |
17 |
16 |
37 |
28 |
| Record period |
1965-1981 |
1965-1980 |
1965-2001 |
1965-1992 |
| Hottest month |
October |
September |
November |
November |
Average temperature
of the hottest month (°C) |
18.81 |
24.05 |
16.12 |
22.85 |
|
| Coldest month |
March |
July |
July |
July |
Average temperature
of the coldest month (°C) |
17.52 |
23.58 |
14.76 |
20.45 |
| Continentality index Ic |
1.29 |
0.47 |
1.36 |
2.40 |
Mean annual temperature
Tmean (°C) |
18.23 |
23.79 |
15.71 |
21.80 |
Mean of the monthly minimum
temperatures
Tmin (°C) |
11.06 |
13.86 |
7.44 |
13.24 |
Mean of the monthly maximum
temperatures
Tmax (°C) |
26.06 |
33.33 |
24.68 |
31.85 |
| Thermicity index It |
553 |
710 |
478 |
669 |
| Positive temperature index Tp |
2187 |
2855 |
1885 |
2616 |
Table 4. Classification of stations based on bioclimatological indexes.
| Index |
Catacocha |
Catamayo |
La Argelia |
Zamora |
| Continentality |
Hyperoceanic |
Hyperoceanic |
Hyperoceanic |
Hyperoceanic |
| Thermicity |
Thermotropical |
Thermotropical |
Mesotropical |
Thermotropical |
| Positive temperature |
Mesotropical |
Thermotropical |
Mesotropical |
Thermotropical |
|
The low continentality index of the stations along the study transect
justifies its classification as hyperoceanic (Table 1).
This is attributed primarily to its geographical location near the Equator, and secondarily
to its near proximity to the Pacific Ocean.
7. SUMMARY
Ongoing ecohydroclimatological research along the
Catacocha-Zamora transect in the provinces of Loja and Zamora-Chinchipe, Ecuador, is reported.
Mean annual precipitation varies between 400 mm in Catamayo, along the study transect,
to 2200 mm in Zamora, toward the eastern limit. Precipitation data indicates that
mean annual precipitation may reach 6259 mm in an isolated point at Cerro del
Consuelo, in the Podocarpus National Park, near Loja. Altitudinal variations are also quite
marked, between 1230 m in Catamayo, to 2930 m in Cerro del Consuelo, to 900 m in Zamora.
Ecohydrological and hydroclimatological data are examined with the aim
of underpinning research in the nascent field of ecohydroclimatology.
REFERENCES
Cole, M. 1960. Cerrado, caatinga, and pantanal: The distribution and origin of the
savanna vegetation of Brazil. Geographical Journal, Vol. 129, 168-179.
Holdridge, L. R. 1947,
Determinations of world plant formations from simple climatic data.
Science, Vol. 105 (2727), 367-368.
Meinzer, O. E. 1927. Plants as indicators of ground water. U.S. Geological Survey
Water Supply Paper 577, Washington, D.C.
Ponce, V. M., and C. N. da Cunha. 1993. Vegetated earthmounds in tropical savannas of Central Brazil:
A synthesis; with special reference to the Pantanal of Mato Grosso.
Journal of Biogeography, Vol. 20, 219-225.
Ponce, V. M., 1995. Hydrologic and environmental impact of the Parana-Paraguay Waterway
on the Pantanal of Mato Grosso. Report, San Diego State University, San Diego, California, August.
Ponce, V. M., A. K. Lohani, and P. T. Huston. 1997.
Surface albedo and water resources: Hydroclimatological impact
of human activities. Journal of Hydrologic Engineering, ASCE, Vol. 2, No. 4, October, 197-203.
Ponce, V. M., R. P. Pandey, and S. Ercan. 2000. Characterization of drought
across climatic spectrum. Journal of Hydrologic Engineering, ASCE, Vol. 5, No. 2, April, 222-224.
Ponce, V. M., 2006. Impact of
the proposed Campo landfill on the hydrology of the Tierra del Sol watershed. Online report.
Ponce, V. M., 2008. Flood hydrology of the La Leche river,
Lambayeque, Peru. Online report.
Pulgar, I., J. Izco, and O. Jadan. 2010. Flora selecta de los pajonales de Loja, Ecuador. Ediciones Abya-Yala,
Quito, Ecuador. 175 p.
Rivas-Martínez, S. 2007. Mapa de series, geoseries, y geopermaseries
de vegetación de España. Memoria del mapa de vegetación potential
de España. I. Itinera Geobotanica, Vol. 17, 5-435.
Wolf, T. 1892. Geografía y Geología del Ecuador, publicada por orden del Supremo Gobierno de la República, Leipzig, Germany.
|