HYDROECOLOGICAL CHARACTERIZATION OF ARROYO ALAMAR,
TIJUANA, BAJA CALIFORNIA, MEXICO

FINAL REPORT

March 24, 2004

Victor M. Ponce, Ana Elena Espinoza, Jose Delgadillo, Alberto Castro, and Ricardo Celis


1. INTRODUCTION

The H. Ayuntamiento de Tijuana (Municipality of Tijuana) has among its current projects the rehabilitation of Arroyo Alamar, a tributary of the Tijuana river. The project will satisfy a host of urban-planning needs, such as the preservation of riparian areas, flood management, planned land use, recreation, landscaping, a green corridor, replenishment of groundwater, improvement of water quality, and compliance with federal stream zoning restrictions.

The project encompasses the 10-km reach of Arroyo Alamar, located between the bridge on the toll road to Tecate, and the channelized reach near the confluence with the Tijuana river. The objective of the project is to rehabilitate the Arroyo Alamar and its flood plain to encourage planned land use and preserve primary hydroecological functions.

The Municipality of Tijuana has developed a preliminary land-use plan which includes a diversity of uses such as agricultural, industrial, urban, recreation, and flood prevention and mitigation. A hydrological study to determine design flood magnitudes has been completed by the Principal Investigator Dr. Victor M. Ponce, in a FY2000 SCERP-funded project. For return periods of 2, 5, 10, 25, 50, 100, 200, 500, and 1000 years, the flood discharges are: 280, 530, 680, 930, 1140, 1310, 1420, 1600, and 1720 m3 s-1, respectively.

This report continues the hydrological study to its next logical step, i.e., the development of a hydroecological characterization aimed at determining flood levels that are congruent with the proposed land uses. The work includes close consultation with cognizant federal agencies to determine applicable stream zoning restrictions.

Tijuana's city planners envision the rehabilitation of Arroyo Alamar to have the essential character of a green corridor, with multiple land uses in tune with the primary flood-mitigation, aquifer-replenishment, and riparian-habitat functions. In a city with very few large tracts of greenery, the hydroecological rehabilitation of Arroyo Alamar is a highly desirable project. The concrete-channel alternative used in the development of the First, Second, and Third Phases of the Rio Tijuana is no longer a viable alternative, given its marked negative impacts of the landscape and environment. Thus, this project assists the Municipality of Tijuana in furthering their goals of rehabilitating the Arroyo Alamar with an ecologically sound approach.

2. RESEARCH OBJECTIVES

The specific objectives of this project are the following:

  1. To determine the channel properties that are compatible with primary hydroecological functions. These include the cross-sectional geometry, longitudinal slopes, bank protection, and percolation to ground water. The study encompasses the preservation and enhancement of existing riparian corridors, the rehabilitation of degraded riparian areas where warranted, and the selection of alternative land uses.
  2. The determination of the flood frequencies to be implemented in the characterization, and the hydraulic design of the hydroecological channel to convey the selected flood flows.

3. RESEARCH METHODOLOGY / APPROACHES

The research method/approach consists of the following steps:

  1. Assemble land-use information, including existing and planned developments, riparian, agriculture, industry, recreation, tourism, and other areas.

  2. Consultation meetings with officials of the Comisión Nacional del Agua, in Mexicali and Mexico City, to establish appropriate flood frequencies to be used in the design.

  3. Hydrological and ecological design of the rehabilitated channel and its flood plain. This includes the modeling of flood flows using the standard U.S. Army Corps of Engineers HEC-RAS (Hydrologic Engineering Center - River Analysis System) model, Version 3.0. The ecological design includes the selection and establishment of riparian, agriculture, industry, recreation, and other multi-purpose areas within the project site.

  4. To establish the need, where appropriate, to stabilize the stream channel by means of bank protection, grade control, and other suitable means, with the objetive of sustaining the design flood flows.

Project site along the northeastern portion of the city of Tijuana

Fig. 1  Project site along the northeastern portion of the city of Tijuana; outside (solid) lines delimit project area; inside lines delimit federal zone.

Preliminary appraisal based on Mexican hydrological practice indicates that the federal frequency should be at least 10 yr, and the project design frequency should be 1000 yr. The characterization encompasses the entire length of the Arroyo Alamar rehabilitation project, from its upstream end at the bridge over the Tecate toll road to its downstream end about 10 km downstream, to connect with the Second Phase of the Rio Tijuana. This includes three distinct sections:

  1. From the bridge at the Tecate toll road to the bridge at Boulevard Héctor Terán Terán.
  2. From the bridge at Boulevard Teran Teran to the bridge at Boulevard Manuel J. Clouthier.
  3. From the bridge at Boulevard Clouthier to the end of the Second Phase of the Rio Tijuana.
Several site visits were carried out, with the objective of ascertaining the parameters, including riparian areas, friction coefficients, land use, and other influences on the characterization.

The hydraulic modeling was performed using 500 cross sections, each every 20 m. This was necessary to ensure stability and accuracy of the backwater computation, enabling a precise delineation of the design flood stages.

The hydroecological characterization is based on the principle of mixed use of the stream channel, including riparian, agriculture, light industry, recreation, tourism, and water quality management. The cross-sectional design reflects the mixed uses and different flooding risks associated with those uses. A two-frequency compound channel is envisioned, with federal and soft-use zones. The federal zone is left to convey the regulation flood (10-yr frequency); the soft-use zone houses riparian, recreation, and ecotourism zones (1000-yr frequency).

4. PROBLEMS / ISSUES ENCOUNTERED

We used the 5-m topographic information to develop the hydroecological characterization. Detailed topographic information to 1-m resolution, which is required for final design, remains to be developed. The hydroecological design is to be taken as the level of feasibility study, pending more detailed studies when the detailed topographic information is developed.

5. RESEARCH FINDINGS

5.1 Gabion-lined channel systems

To remain stable and satisfy its intended use, a hydroecological channel requires some type of bank protection. Gabions are usually considered as a compromise between concrete lining, riprap or natural vegetation.

A gabion system is wire-enclosed riprap consisting of mats or baskets fabricated with wire mesh, filled with small riprap, and anchored to a slope.

Layout and dimensions of gabion boxes and mattresses

Fig. 2  Layout and dimensions of gabion boxes and mattresses.

Wrapping the riprap enables the use of smaller stone sizes for the same resistance to displacement by water energy. This is a particular advantage when constructing rock lining in areas of difficult access. The wire basket also allows steeper (up to vertical) channel linings to be constructed from commercially available wire units or from wire-fencing material.

Due to their high shear strength, gabion systems provide a highly effective way to control erosion in streams, rivers and canals. They are normally designed to sustain channel velocities of 15 fps or higher. Gabions are constructed by individual units that vary in length from 6 ft to nearly 100 ft (gabion mats); therefore, applications can range anywhere from small ditches to large canals.

Gabion channels are a compromise between riprap and concrete. When the same-size rocks are used in gabions and riprap, the acceptable velocity for gabions is at least 3-4 times that of riprap. Unlike concrete, gabions can be vegetated to blend into the natural landscape.

Example of vegetated gabion channel

Fig. 3 (a)  Example of vegetated gabion channel.

Example of vegetated gabion channel

Fig. 3 (b)  Example of vegetated gabion channel.

Example of vegetated gabion channel

Fig. 3 (c)  Example of vegetated gabion channel.

Gabion channels with vegetation have the following advantages:

  • They allow infiltration and exfiltration.
  • They filter out contaminants.
  • They are more flexible than paved channels (Fig. 4).
  • They provide greater energy dissipation than concrete channels (Fig. 5).
  • They improve habitat for flora and fauna.
  • They are more aesthetically pleasing.
  • They have lower cost to install, although some maintenance is required.

Failure of paved channels due to lack of flexibility

Fig. 4 (a)  Failure of paved channels due to lack of flexibility.

Failure of paved channels due to lack of flexibility

Fig. 4 (b)  Failure of paved channels due to lack of flexibility.

Failure of paved channels due to lack of flexibility

Fig. 4 (c)  Failure of paved channels due to lack of flexibility.

Gabion-lined spillway provides energy dissipation

Fig. 5  Gabion-lined spillway provides energy dissipation.

The Manning's n or roughness coefficient for gabion channels with vegetation depends primarily on the type of vegetation and the size of the stones being used. There is no specific formula for the roughness coefficient for gabion channels with vegetation. The roughness coefficient can be derived by knowing other values of Manning's n and relating them to the specific case. For gabions without vegetation, Manning's n ranges from 0.025 to 0.03. Manning's n for vegetated channels also vary depending on the type of soil, the amount of cover, resistance and retardance. Manning's n for vegetative channels is given by the following formula:

equation 1(Eq. 1)

in which R = hydraulic radius; C = retardance coefficient, depending on cover and condition; and S = energy slope (m/m). The retardance coefficient ranges from C = 15.8 for class A vegetation to C = 37.7 for class E vegetation, as shown in Table 1.

Table 1.  Classification of vegetative cover depending on degree of retardance.
Retardance ClassCoverConditionC Value
AWeeping lovegrassExcellent stand, tall, avg.15.8
Yellow bluestem IschawmumExcellent stand, tall, avg.
BKudzuVery dense growth, uncut23.0
Bermuda grassGood Stand, tall, avg.
Native grass mixture (mixture of bluestems)Good stand, unmowed
Weeping lovegrassGood stand, tall,avg.
Lespedeza sericeaGood stand, not woody, tall, avg.
AlfalfaGood stand, uncut, avg.
Weeping lovegrassGood stand, unmoved, avg.
KudzuDense growth, uncut
Blue grammaGood stand, uncut, avg.
CCrabgrassFair stand, uncut, avg.30.2
Bermuda grassGood stand mowed, avg.
Common lespedezaGood stand, uncut, avg.
Grass-legume summer mixtureGood stand, uncut, avg.
CentipedegrassVery dense cover, avg.
Kentucky bluegrassGood stand, headed, avg.
DBermuda grassGood stand34.6
Common lespedezaExcellent stand, uncut, avg.
Buffalo grassGood stand, uncut, avg.
Grass-legume fall mixtureGood stand, uncut 10 to 13 cm
Lespedeza sericeaCut to 5-cm height
EBermuda grassGood stand, cut to 4cm37.7
Bermuda grassBurned stubble

There is no specific formula for Manning's n for channels with concrete, gabion or riprap lining. Table 2 shows frequently used Manning's n.

Table 2.   Values of Manning's n for selected lining materials
Concrete: Trowel finish0.012-0.014
Concrete: Float finish0.013-0.017
Gunite0.016-0.022
Flagstone0.020-0.025
Gabions0.025-0.030
Riprap0.040-0.070

Riprap channels have a very large range of Manning's n, depending on the stone diameter and the flow depth. The Manning's n of the composite channel is given by the following formula:

equation 2(Eq. 2)

in which nl , nb , nr , nc= Manning's n of the left side slope, bottom, right side slope and composite channel, respectively; Pl , Pb , Pr , Pc= wetted perimeter of the left side slope, bottom, right side slope, and composite channel, respectively.

In gabion channels with vegetation (Fig. 6), the value of Manning's n is estimated by experience.

 A gabion channel with vegetation

Fig. 6   A gabion channel with vegetation
(Source: Maccaferri, Inc).

The procedure for placing and filling gabions can be summarized as follows:

  1. Assembling the individual units before placing (Fig. 7);
  2. Placing them and wiring them together and filling the units with rocks (Fig. 8); and
  3. Closing and wiring down the lids (Fig. 9).

Assembling the individual units before placing

Fig. 7  Assembling the individual units before placing.

Filling the units with rocks

Fig. 8  Filling the units with rocks.

;Closure of gabions using single lids or mesh rolls

Fig. 9  Closure of gabions using single lids or mesh rolls.

Gabions can be placed on dry bank (Fig. 10) or under water (Fig. 11). Linings laid in dry conditions are placed directly on a stable slope which is not too steep as to cause the revetment to slide. The units are normally laid down on the slope of the bank, at right angles to the current. However, the units on the bed itself should be laid in the direction of flow.

Placing gabions on dry banks

Fig. 10  Placing gabions on dry banks.

Placing gabions under water

Fig. 11  Placing gabions under water.

When constructing a lining under water, dumping riprap is challenged by the many uncertainties, since it is difficult to obtain a uniform distribution of the material over the whole area to be protected. In order to reduce the risk, the amount of rocks dumped has to be increased by 50%. This problem does not arise with gabions, since the structure is preassembled and of fixed thickness. The gabions are placed using cranes or pontoons (Fig. 12).

The stability of gabion linings depends on the strength of the mesh, the thickness of the lining and the grading of the stone fill. Once the water velocity is known, these parameters can be selected. For longevity of the revetment, the mesh must be protected from corrosion. Gabions are constructed from wires with heavy zinc content and PVC coating.

Using a pontoon to place the gabion mattress

Fig. 12  Using a pontoon to place the gabion mattress.

The two primary elements in channel design are cross-sectional shape and lining (Fig. 13). Lining is determined by erosion resistance and drainage requirements. Vegetated linings are appropiate for low velocities. Paved linings may be used for soil-water interfaces where the soil and groundwater conditions are such that the soil may erode under the design flow. Generally, velocities over 1.5 m/s require lined waterways.

Usual types of channel linings in gabions and gabion mats

Fig. 13  Usual types of channel linings in gabions and gabion mats.

For design purposes, uniform flow conditions are usually assumed, with friction (or energy) slope (Sf ) equal to average bed slope (So). This allows the flow conditions to be defined by a uniform flow equation such as Manning's. Supercritical flow creates surface waves of depth comparable to the flow depth. For very steep channel gradients, the flow may splash and surge; therefore special considerations for freeboard are required.

Once the basic hydraulic and physical characteristics of the channel have been determined, the selection of the lining and stability analysis can be made. Generally, a 10-yr to a 100-yr storm (1000-yr storm in Mexico) is used to determine capacity, while the 2-yr storm is used for channel stability. After vegetation is fully developed, the channel is considered stable and capacity becomes more critical.

Channels should be designed so that the flow velocity does not exceed the permissible velocity for the type of lining used. It is also important to check outlets for stability. Excessive velocities or grade changes may require protective or stabilizing structures, transition sections, or energy dissipators to prevent erosion or scour.

5.2 Hydrological design of Arroyo Alamar

To perform the hydrological design of the rehabilitated channel includes the determination of flood discharges, for selected design frequencies, and the calculation of water-surface profiles. The U.S. Army Corps of Engineers HEC-RAS (Hydraulic Engineering Center - River Analysis System) model was used to calculate the water-surface profiles.

A hydrological study to determine design flood discharges for 2-yr to 1,000-yr frequencies has been performed by Ponce (2000). The results are shown in Table 3.

Table 3. Arroyo Alamar flood discharges calculated using mathematical modeling.
Return period
(yr)
Flood discharge
Q (m3/s)
2 280
5 530
10 680
25 930
50 1,140
100 1,310
200 1,420
500 1,600
1,000 1,720

The 1,000-yr frequency is used by the Comision Nacional del Agua to design flood control channels in urban environments. To determine the freeboard, there is a need to go beyond the 1,000-yr frequency. According to USDA Natural Resources Conservation Service (NRCS) methodology, for urban flood control projects such as the Arroyo Alamar rehabilitation, the freeboard hydrograph should be designed to safely pass the Probable Maximum Precipitation (PMP). There is no PMP determination for Mexico. In places where it does not exist, the PMP is commonly approximated as the 10,000-yr frequency.

With the 2-yr to 1000-yr frequency floods determined by mathematical modeling, the Gumbel method was used to calculate the 5,000-yr and 10,000-yr flood discharges. Fig. 14 shows the Gumbel fitting and Table 4 shows the estimated discharges.

Gumbel fitting for Arroyo Alamar 5,000-yr and 10,000-yr flood discharges

Fig. 14   Gumbel fitting for Arroyo Alamar 5,000-yr and 10,000-yr flood discharges.


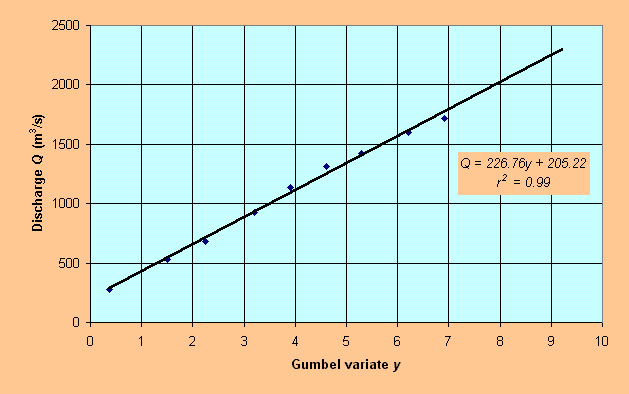
Table 4. Estimated discharges using the Gumbel method.
Return period
(yr)
Gumbel variate
y
Flood discharge
Q (m3/s)
5,000 8.52 2,140
10,000 9.21 2,290

To perform the HEC-RAS modeling, the design channel alignment was obtained from Tijuana officials. The project has a total channel length of 9880.849 m. The upstream point, with invert elevation 80 m, is at the bridge over Cañon del Padre, on the toll road to Tecate (Fig. 15). The downstream point, with invert elevation 40 m, is at the beginning of the concrete-lined reach of Arroyo Alamar, near the confluence with the Tijuana river (Fig. 16). This provides an average channel slope of 0.004048.

Upstream end of Arroyo Alamar rehabilitation project, at Puente Cañon del Padre

Fig. 15  Upstream end of Arroyo Alamar rehabilitation project, at Puente Cañon del Padre.

Downstream end of Arroyo Alamar rehabilitation project

Fig. 16  Downstream end of Arroyo Alamar rehabilitation project, at the beginning of the
concrete-lined reach, near the confluence with the Tijuana river.

The project reach, of length 9880.849 m, was subdivided into reaches at an equidistance of 20 m, for a total of 494 reaches and 495 cross sections. The small reach interval (20 m) was adopted to ensure the accuracy of the water-surface profile computation. River stations are numbered from 001 to 495.

A prismatic channel of a chosen cross-sectional geometry was adopted for design. The channel consists of a main channel and left and right overbank channels (flood plains). The bottom width of the main channel is 40 m, and the main channel depth is 3.8 m. The side slopes of the main channel are 2 horizontal to 1 vertical.

The overbank channels are 20 m wide each, with channel depth 3.0 m. and side slopes 2 H:1 V. The overbank channels drain into the main channel with a 1% transversal slope. Figure 17 shows the channel design.

 Arroyo Alamar channel design

Fig. 17   Arroyo Alamar channel design.

In HEC-RAS, cross-sectional data is entered from left to right, looking in the downstream direction. The left channel bottom x-coordinate was specified as 100 m, and the corresponding cross-sectional coordinates were calculated using a spreadsheet. The x-coordinate left overbank limit is 92.4 m, and the x-coordinate right overbank limit is 147.6 m.

Figure 18 shows typical cross sections generated by HEC-RAS for the discharge of 550 m3/sec.

Result generated by HEC-RAS for the flood discharge of 550 m3/sec at cross section 001.

Fig. 18 (a)   Result generated by HEC-RAS for the flood discharge of 550 m3/sec at cross section 001.

Result generated by HEC-RAS for the flood discharge of 550 m3/sec at cross section 495

Fig. 18 (b)   Result generated by HEC-RAS for the flood discharge of 550 m3/sec at cross section 495.

Several types of loss coefficients are utilized by HEC-RAS to evaluate energy losses. These are the Manning's n for friction (boundary) loss, contraction and expansion coefficients to evaluate transition loss, and bridge and culvert loss coefficients. At the present level of approximation, all secondary energy-loss coefficients have been neglected.

Appropriate values of Manning's n are significant to the accuracy of the calculated water surface profiles. The Manning's n value depends on a number of factors, including surface roughness, amount and type of vegetation, channel irregularities, channel alignment, scour and deposition, presence of obstructions, size and shape of channel, stage and discharge, seasonal changes, temperature, and bed material load.

Manning's n values for inbank channel flow was estimated at 0.035, and for overbank flow at 0.075. These values are consistent with established practice. The values of Manning's n recommended by HEC-RAS for natural streams are shown in Table 5.

Table 5. Manning's n values recommended by HEC-RAS for natural streams.
Type of channel and description
Minimum
Normal
Maximum
1. Main channels
a. Clean, straight, full stage, no rifts or deep pools
0.025
0.030
0.033
b. Same as above, but more stones and weeds
0.030
0.035
0.040
c. Clean, winding, some pools and shoals
0.033
0.040
0.045
d. Same as above, but some weeds and stones
0.035
0.045
0.050
e. Same as above, lower stages, more ineffective slopes and sections
0.040
0.048
0.055
f. Same as "d" but more stones
0.045
0.050
0.060
g. Sluggish reaches, weedy, deep pools
0.050
0.070
0.080
h. Very weedy reaches, deep pools, or floodways with heavy stands of timber and brush
0.070
0.100
0.150
2. Flood Plains
a. Pasture no brush  
1. Short grass
0.025
0.030
0.035
2. High grass
0.030
0.035
0.050
b. Cultivated areas  
1. No crop
0.020
0.030
0.040
2. Mature row crops
0.025
0.035
0.045
3. Mature field crops
0.030
0.040
0.050
c. Brush  
1. Scattered brush, heavy weeds
0.035
0.050
0.070
2. Light brush and trees, in winter
0.035
0.050
0.060
3. Light brush and trees, in summer
0.040
0.060
0.080
4. Medium dense brush, in winter
0.045
0.070
0.110
5. Medium dense brush, in summer
0.070
0.100
0.160
d. Trees  
1. Cleared land with tree stumps, no sprouts
0.030
0.040
0.050
2. Same as above but heavy sprouts
0.050
0.060
0.080
3. Heavy stand of timber, few down trees, little
    undergrowth, flood stage below branches
0.080
0.100
0.120
4. Same as above but with flood stage reaching
    branches
0.100
0.120
0.160
5. Dense willows, summer straight
0.110
0.150
0.200
3. Mountain streams, no vegetation in channel, banks usually steep,
   with trees and brush on bank submerged
a. Bottom: gravels, cobbles, and few boulders
0.030
0.040
0.050
b. Bottom: cobbles with large boulders
0.040
0.050
0.070

The boundary condition is necessary to establish the starting water-surface elevation at either end of the channel system. Since the flow is subcritical, the boundary condition is specified at the downstream end. The average channel slope So= 0.004048 has been specified as the downstream boundary condition in the present study.

Flood discharge information is required at each cross section in order to compute the water-surface profile. The flow value is entered at the upstream end of the reach, and it assumes that the flow remains constant until another flow value is encountered with the same reach. The flood discharges corresponding to 10-, 50-, 100-, 500-, 1000-, 5000- and 10000-yr return periods were used to calculate water-surface profiles with HEC-RAS. In addition, the flood discharge of 550 m3/sec, estimated as the 10-yr flood by Comision Nacional del Agua, was also considered.

The HEC-RAS model results are shown in Table 6. Flow depths vary from 3.278 m to 6.779 m; inbank flow velocities vary from 3.6 to 6.04 m/s; overbank flow velocities vary from 0.77 to 1.56 m/s. The design flow velocity for inbank gabion lining is that corresponding to the 1000-yr flood: 5.45 m/s. For the 1000-yr design flood discharge, the freeboard is 1.117 m.

Table 6. HEC-RAS results showing flow depths, mean velocities, Froude numbers, and freeboard for corresponding return periods.
Return period
(yr)

Discharge (m3/s)

Flow depth (m) Inbank flow mean velocity (m/s) Overbank flow mean velocity (m/s) Froude number Freeboard (m)
- 550 3.278 3.60 - 0.68 0.522
10 680 3.706 3.87 - 0.69 0.094
50 1140 4.810 4.70 0.77 0.72 2.190
100 1310 5.147 4.62 1.18 0.73 1.873
500 1600 5.677 5.31 1.17 0.75 1.323
1000 1720 5.883 5.45 1.25 0.75 1.117
5000 2140 6.554 5.90 1.49 0.77 0.450
10000 2290 6.779 6.04 1.56 0.77 0.221

5.3 Ecology and flora of Arroyo Alamar

The Arroyo Alamar is part of the Tijuana river watershed. Therefore, its physical and biological characteristics are similar to the majority of the watersheds and river basins located in the northwestern part of Baja California and Southern California. According to the degree of disturbance, the various arroyos which form part of the watershed are divided into three classes:

  • Disturbed in urban areas.

  • Disturbed in suburban areas.

  • Undisturbed in natural areas.

River channelization is accomplished to reduce the risk of catastrophic flooding. However, it reduces riparian habitat, segmenting the local ecology and vegetation. Riparian vegetation is characterized by rapid colonization, high productivity, good dispersion properties, a lowering of species numbers, and a dominance of woody species, specially the willows.

Ecologically, these areas have been classified as riparian, that is, the biological communities that lie along the streams and washes. Biodiversity refers to the variety of biological species and its life forms within an ecosystem. The term "undisturbed" implies a process which significantly alters the patterns of structure and form of an ecosystem, and is usually applied in reference to human activities.

Hydrologic, climatic, and substrate factors determine the composition and, therefore, the structure and function of the riparian vegetation. The riparian ecosystems are protected from strong winds and extreme dry summers. However, this causes the destruction of some vegetation and the creation of new sites for the establishment of new vegetation (Gregory et al., 1991).

From an ecological perspective, the Arroyo Alamar can be divided into three zones:

  1. Zone I, from the concrete channelization to the Cañon del Padre bridge.

  2. Zone II, from the Cañon del Padre bridge to the city of Tecate.

  3. Zone III, from the city of Tecate to its headwaters in eastern San Diego County and the municipality of Tecate.

Zone I lies within the urban limits of the city of Tijuana. It is the most disturbed and polluted of the three zones, and it features many irregular human settlements. The riparian environment and its ecology are heavily impacted by the trash and debris dumps, as well as by stagnant polluted water. It can be divided into three areas:

  1. From the concrete channelization to the Manuel J. Clouthier Boulevard: human settlements, deposits of trash and debris, and polluted surface water. This zone represents a great public health hazard. Several water wells function to provide water for agriculture and recreation.

  2. From Manuel J. Clouthier Boulevard to Terán Terán Boulevard: a few human settlements and trash and debris dumps, stagnant water, mining of sand and gravel, and agriculture.

  3. From the Terán Terán Boulevard to the Cañon del Padre bridge: some trash and debris, brick manufacturing facilities, agriculture and grazing. This is the better preserved area in terms of riparian vegetation (Fig. 19).

View of Arroyo Alamar immediately downstream of Cañon del Padre bridge

Fig. 19  View of Arroyo Alamar immediately downstream of Cañon del Padre bridge.

Zone II shows water pollution from Arroyo Tecate; its vegetation and riparian environments do not show great human impact. Zone III is subject to very little pollution, and its riparian environment is largely unaffected by human activities.

The biological communities are described in terms of their floristic components and their biological forms. The floristic component is assessed by listing all the plants found in a region or area; the biological forms are either trees, shrubs, or grasses. The flora of Arroyo Alamar has a great diversity of native plants and quite a few introduced plants. The latter are characteristic of disturbed environments, principally in Zone I. According to the listings of flora in the official Mexican norm NOM-059-2001, there are no endemic plants, rare plants, or plants in danger of extinction. Table 7 lists the floristic component of Arroyo Alamar.

Table 7.  Floristic component of Arroyo Alamar.
Species Common name (English) Common name (Spanish) Biological form Origin
Ambrosia confertiflora - - grass Nativa
Anemopsis californica [hierba del manzo] hierba del manzo semiaquatic grass Native
Apium graveolens celery ápio aquatic grass Introduced from Eurasia
Arundo donax reed carrizo tall-stem grass Introduced from Europe
Baccharis glutinosa [huatamote ] huatamote shrub Native
Brassica campestris[moztacilla] moztacillagrass Introduced from Europe
Chenopodium murale - - grass Introduced from Europe
Chrysantemum coronarium chrysanthemum crisantemo grass Introduced from Europe
Cotula coronopifolia - - semiaquatic grass Introduced from Africa
Cynodon dactylon [zacate pata de gallo] zacate pata de gallo grass Introduced from Africa
Foenicullum vulgare anise anís grass Introduced from Europe
Helianthemum annum sunflowergirasol grass Introduced from Europe
Heliotropium curassavicum - - grass Introduced from tropical America
Juncus acutus rush junco small shrub Native
Marrubium vulgare [marrubio] marrubio grass Introduced from Europe
Nicotiana glauca [tabaquillo] tabaquillo shrub Introduced from South America
Platanus racemosa alderaliso tree Native
Populus fremontii poplar alamo tree Native
Riccinis comunis [higuerilla] higuerilla small tree Introduced from Europe
Rorripa nasturtium-aquaticum watercress berro aquatic grass Native
Rumex crispus - - grass Introduced from Eurasia
Rumex salicifolius - - grass Native
Salis lasiolepis willow sauce tree Native
Salix goodingii willow sauce tree Native
Scirpus spp. - - grass Native
Solanum spp. - - grass -
Tamarix ramossisima - - tree Introduced from Eurasia
Urtica holosericea [hortiguilla] hortiguilla grass Native
Xanthium strumarium - - grass Native

The climax vegetation of Arroyo Alamar is of riparian corridor type. It is dominated by deciduous trees which help reduce soil erosion and provide habitat for other biological communities.

For many years, ecologists have referred to wide-leaf riparian species such as Populus, Salix, Fraxinus, Platanus and others, as obligatory riparian species. These and other terms such as facultative and pseudoriparian have been applied to diverse riparian species. The U.S. Fish and Wildlife Service has adopted the following terms: "true riparian" for the obligatory riparian, and "pseudoriparian" for the facultative riparian (Reichenbacher, 1984). However, some riparian plants are greatly dependent on the surface water and others on the subsurface water, being quite distinct from the phreatophytes (Smith et al., 1991).

In Zone I, the native vegetation has disappeared almost completely. It was formed by species of trees such as willows (Salix spp.), poplars (Populus fremontii) and alder (Platanus racemosa). These species have almost disappeared, except a few species of willows and a few individuals of poplars and alders along the river banks.

The climax vegetation of this arroyo would be an asociacion of willows and poplars. The willows have a high degree of colonization in Zone I, where it can cover up to 100%. This response of the willows may be due to the large anhropogenic disturbance and to the large deposits of organic matter and nitrate. On the other hand, Zones II and III do not present large populations of these species.

At the present time, the vegetation of Arroyo Alamar in those areas where there is good coverage of vegetation consists of three strata: trees, shrubs, and grasses. In addition, there are also some aquatic and semiaquatic plants.

  • Trees: Dominated first by a type of willow (Salix goodingii) and secondly, by Salix lasiolepis. These are native species, with heights varying from 4 to 15 m, located along the water course and in contact with it.

  • Shrubs: Dominated by two native shrubs, Baccharis glutinosa and Baccharis sarothroides, growing principally outside of the main channel on top of accumulations of sand.

  • Grasses: This strata varies with regard to native and introduced plants, the latter being favored due to the altered environment.

  • Aquatic and semiaquatic plants: Plants which are located in the main channel, under water, or in lagoons in the surroundings..

The most frequent species in aquatic and semiaquatic ecosystems are: Azzola filiculoides, Anemopsis californica, Callitriche orcutti, Cyperus laevigatus, Cyperus lanceolatus, Eleocharis acicularis, Eleocharis geniculata, Eleocharis palustris, Eleocharis parishii, Epilobium adenocaulis var. parishii, Juncus acutus, Juncus bufonius, Juncus sphaerocarpus, Juncus rugulosus, Juncus xiphioides, Lemna trisulca, Lemna valdiviana, Lemna gibba, Lilae subulata, Marsilia fournieri, Mimulus gutatus, Nasturtium officinale, Ophioglossum californicum, Pilularia americana, Ranunuculus cymbaralia, Sagittaria cuneata, Sagittaria greggi, Scirpus acutus, Typha dominguensis, Typha latifolia, Zannichella palustris; besides the introduced reeds Arundo donax and Phragmites australis.

The species Nicotiana glauca) and Salsola kali var. tenuifolia establish themselves quite readily in agricultural and urban areas. Other species occupy areas that have been disturbed; among these are Baccharis sarothroides, Baccharis glutinosa, Erodium cicutarium, Brassica campestris, Haplopappus venetus, Taraxacum officinale, Xanthium strumarium, Ambrosia psilostachya, Cirsium vulgare, Sonchus oleraceus and Datura discolor.

5.4 Design velocities for vegetated and gabion-lined channels

The flow velocity in watercourses has a direct relation to boundary roughness and bank stability. When all other variables are held constant, the boundary roughness decreases as the velocity increases. When the velocity increases, the shear stress increases on the bed and bank material. In turn, this increases the rate of erosion and sediment transport.

There are several ways to protect the stream channel against bed and bank erosion. The bed and banks can be protected directly by using different types of lining, made from both artificial and natural materials. Artificial linings include concrete, gabions, and dumped rock. Natural linings include lawns, vegetated mattresses and bundles of wood.

Table 8 shows a comparison between vegetated and gabion-lined channels.

Table 8. Comparison between vegetated and gabion-lined channels
Vegetated channels Gabion-lined channels
Advantages Disadvantages Advantages Disadvantages

  • Higher infiltration and exfiltration
  • Excellent habitat function
  • Sizable reduction in flow velocity
  • Aesthetically very pleasing

  • Low structural integrity
  • Protection is usually not immediate after installation

  • High stability
  • Moderate infiltration and exfiltration
  • Immediate protection after installation
  • Moderate reduction in flow velocity

  • Less aesthetically pleasing
  • Limited habitat function

Stabilization with gabions

Gabions consist of mesh baskets filled with small riprap. A gabion structure can consist of several baskets (Fig. 2). Since the riprap is enclosed within a wire mesh, it has high stability against erosion. Vegetation can be planted and is able to grow between the gabions layers (Fig. 20). Planting vegetation in gabions provides habitat, decreases the flow velocity during storm events and increases their aesthetic appeal.

woody vegetation

Fig. 20 (a)  Woody vegetation in gabions.

woody vegetation

Fig. 20 (b)  Woody vegetation in gabions.

Growth of woody vegetation in gabions

Fig. 20 (c)  Growth of woody vegetation in gabions.

Natural bank stabilization

In bank stabilization using natural vegetation, attention must be paid to the temporal wetting zones to assure habitat sustainability. The temporal wetting zones are: (1) Permanently wetted, (2) Intermittently wetted, and (3) Event wetted, or flood plain.

In permanently wetted zones, wattle and fascines are used in various types of assemblies, as shown in Fig. 21. The wattles are staked 30-50 cm into the ground and the stakes are braided with flexible strong brushwood. The height of the wattle assembly is 30-80 cm.

Wattle assembly for natural bank stabilization

Fig. 21 Wattle assembly for natural bank stabilization.

Fascines can be built as sausages or rolls. The fascine sausages are cylindrical bodies of willow rods with a length of 10-20 m and a diameter of 0.10-0.15 m. They are manufactured from flexible brushwood with a length of 2.5-3.0 m, and anchored with stakes of 4-5 cm thickness and length of about 1 m (Fig. 22).

Preparation of fasciness

Fig. 22 (a)  Preparation of fascines.

Installation of fascines

Fig. 22 (b)  Installation of fascines.

Completed fascines

Fig. 22 (c)  Completed fascines.

The fascines rolls are in structure similar to the fascine sausages, with a diameter of 0.25-0.40 m, and 1/3 to 2/3 of their thickness placed under the average baseflow level. Weighted fascines are cylindrical bodies with a diameter of 0.80-1.20 m. They consist of a 0.15-0.20 m thick coat of brush wood and a core of rough gravel or crushed rock (Fig. 23).

Weighted fascines

Fig. 23 (a)  Weighted fascines.

Weighted fascines

Fig. 23 (b)  Weighted fascines.

Cattails are placed in the intermittently wetted zone. In the event-wetted zone, the following natural building materials are used: (1) finished lawn, and (2) grass seeding. The lawn pieces are square turf sods with a edge length of 25-30 cm and a thickness of 3-8 cm, imported into place. Lawns are laid flat or in stacks. Flat lawns use bank slopes of 1.5:1-2:1, with 3:1 being rarely used (Fig. 24). Areas with high shear stress should be anchored with stakes of length 20-30 cm. Stacked lawns use bank slopes of 0.75:1 for flowing water bodies and 0.3:1-1:1 at walls (Fig. 25).

Flat lawns

Fig. 24 (a)  Flat lawns.

Flat lawns

Fig. 24 (b)  Flat lawns.

Staked lawns

Fig. 25  Staked lawns.

For lawn rolls, the principle is the same as that of flat lawns. Lawn rolls can be handled over larger surfaces, and they can be grown beforehand on special surfaces.

Lawn roll

Fig. 26 (a)  Lawn roll.

Installation of lawn roll

Fig. 26 (b)  Installation of lawn roll.

Lawn seeds are disseminated by wet or dry means (Fig. 27). Young seedlings can be protected against removal by means of fiber mattresses or by mixing with a biodegradable adhesive during seeding (Fig. 28).

Lawn seeding

Fig. 27  Lawn seeding.

Fiber mattress for protection of seeds

Fig. 28  Fiber mattress for protection of seeds.

Vegetative bank stabilization consists of individual components of 2 x 6 m and a thickness of 0.2 m. The materials are a mixture of gravel, plastic mesh, biodegradable geotextiles, and endemic riparian vegetation. The building materials are combined and spread in layers. The assembly can usually withstand large shear stresses (Fig. 29).

Vegetative bank stabilization

Fig. 29  Vegetative bank stabilization.

To stabilize with wood parts, staking woody debris are collected during the winter. These stakes are assembled in one of the following forms: (1) brush mattresses, (2) live staking, and (3) small trees and shrubs. Brush mattresses are anchored to the ground with fascines or wire mesh (Fig. 30). Slopes of 1:1 or flatter may be required to withstand high shear stresses. Water velocities up to 3.5 m/s may be used with brush mattresses.

Plan view of brush mattress

Fig. 30 (a)  Plan view of brush mattress.

Side view of brush mattress

Fig. 30 (b)  Side view of brush mattress.

Live staking uses root-able branch ends with length of 1.0-2.5 m and thickness of 4-6 cm. They are inserted as shown in Fig. 31 (a).

Live staking schematic

Fig. 31 (a)  Live staking schematic.

Live staking soon after installation

Fig. 31 (b)  Live staking soon after installation.

Live staking some time after installation

Fig. 31 (c)  Live staking some time after installation.

Live staking 2-5 years after installation

Fig. 31 (d)  Live staking 2-5 years after installation.

Established live staking

Fig. 31 (e)  Established live staking.

Small trees and shrubs are placed above the baseflow (Fig. 32). They are able to sustain flooding for several days when mature. They are typically used in combination with other measures such as lawn pieces and/or weighted fascines. They provide the following functions:

  1. Stabilization of the bank against erosion.
  2. A mature canopy will provide shading to a good portion of the bank.
  3. Shading reduces the temperature of the water.
  4. For tropical and midlatitudinal climates, this temperature reduction will improve water quality by discouraging the growth of algae and other nuisance species.
  5. This creates a niche habitat for a particular community of flora and fauna.

Bank protection with trees and shrubs

Fig. 32 (a)  Bank protection with trees and shrubs.

Longitudinal view of bank protection with vegetation

Fig. 32 (b)  Longitudinal view of bank protection with vegetation..

Side view of bank protection with vegetation

Fig. 32 (c)  Side view of bank protection with vegetation.

Completed bank  protection with trees and shrubs

Fig. 32 (d)  Completed bank protection with trees and shrubs.

Hydraulic Design

The critical velocity vc and the critical shear stress τc are used in the analysis of the stability of the bottom and the banks of rivers against erosion. The stability can be determined by comparing the actual velocity to the maximum allowable velocity or critical velocity vc based on the bed and bank material.

The Manning equation can be used:

             v = (1/n) R 2/3S 1/2

in which is v = velocity (m/s), n = Manning's n, R = hydraulic radius (m) and S = slope (m/m).

The critical velocity must be determined by experiments or empirically derived from information in the literature. The critical velocity is that at which erosion of the bed and/or bank material begins. The criterion for stability is:

              vvc

Typical values of critical velocity are shown in Table 9.

Table 9. Typical values of critical velocity and shear stress
Material Critical velocity Critical shear stress
 (m/s)  (N/m2)
Lawn (short-time loaded) 1.8 20-30
Lawn (long-time loaded) 1.5 15-18
Fascine sausage 2.5-3.0 60-70
Fascine roll 3.0-3.5 100-150
Weighted fascine 2.5-3.0 60-100
Brush mattress 2.5-3.5 150-300
Live staking in riprap   >140
Willows/alder   80-140
Gabions 1.8-6.7 80-140

The critical shear stress τc is a measure of the stability of the bed and banks of a river against erosion. The bottom shear stress can be calculated as follows:

              τo = γ R S

in which is τo = the bottom shear stress (N/m2), γ = specific weight of water (N/m3), R = hydraulic radius (m) and S = slope (m/m).

For wide channels, i.e., those with a top width T ≥ 10 R, the flow depth h is substituted for R:

              τo = γ h S

The critical shear stress τcmust be determined by experiments or empirically derived from information in the literature. The critical shear stress τc is that at which erosion of the bed and/or bank material begins. The criterion for stability is:

              τ τc

Typical values of critical shear stress are shown in Table 9.

The variety of vegetation cover available in nature implies that there is also a wide variation in resistance to flow. Flow resistance is dependent on whether vegetation is completely or partially submerged. The controlling factor is the height of the canopy in relation to the water depth. The three general cases are (Fig. 33): (1) short, (2) average, and (3) tall vegetation.

Short, average, and tall vegetation

Fig. 33  Short, average, and tall vegetation.

Short vegetation is that which is short in relation to the flow depth, its height being on the same scale as the absolute roughness. The velocity distribution in the cross section resembles that due to absolute roughness. Average vegetation occurs when the plant height is, on the average, the same as the flow depth. It varies between full and partial submersion. The behavior of the resistance to flow demands a special attention to the flow conditions. This is because average vegetation is susceptible to forceful submission (i.e., tilting) when the stream power overcomes the static resistance of the stems. For average vegetation, there is a definite relationship between vegetative resistance and the ratio of plant height to flow depth. Tall vegetation is that which is tall in relation to the flow depth. This definition excludes plants that bend such that their height is decreased below the water surface.

Several examples of roughness coefficients for vegetated channels are shown in Table 10 and Figure 34.

Table 10. Roughness coefficient for vegetated channels.
Surface structure k KSt n
 (m)  (m1/3/s) [Fig. 34]
Lawn 0.06 40 0.025
Grass; field without cover 0.2 30 0.033
Grassland; rocky forest soil 0.25 25 0.040
Grass with shrubs 0.3 24 0.042
Herbaceous vegetation 0.4 22 0.045
Field with arable crop 0.6 21 0.048
Irregular flood plains 0.8 15 0.067
Highly irregular flood plains 1 12 0.083

Irregular flood plains: 0.055

Fig. 34 (a)  Irregular flood plains: 0.055 ≤ n ≤ 0.083.

Herbaceous flood plains

Fig. 34 (b)  Herbaceous flood plains: 0.041 ≤ n ≤ 0.050.

Grasslands flood plains

Fig. 34 (c)  Grasslands flood plains: 0.028 ≤ n ≤ 0.040.

Grasslands flood plains

Fig. 34 (d)  Grasslands flood plains: 0.028 ≤ n ≤ 0.040.

Shrub flood plains

Fig. 34 (e)  Shrub flood plains: 0.028 ≤ n ≤ 0.033.

For conceptually based calculations, the Darcy-Weisbach formula can be used:

       v = (1/ f 1/2) (8 g R S) 1/2    

with

       f = [(4 Ap,i ) / ( ax ay )] cw,i    

for nearly horizontal flood areas, and

       f = [(4 Ap,i cos α) / ( ax ay )] cw,i   

for hillslope flood areas, with

      Ap,i = hi dm,i

The geometric characterization and the equivalent diameter are shown in Fig. 35 and Fig. 36.

Geometric characterization of tree population density

Fig. 35  Geometric characterization of tree population density.

Determination of the equivalent diameter

Fig. 36  Determination of the equivalent diameter.

For an individual specimen, the coefficient of resistance cw,i is equal to that of a circular cylinder for which cw = 1.2.

For groups of trees or bushes, the following formulas can be used:

              f = [(4 Ap ) / ( ax ay )] cw,r

              f = [(4 Ap cos α) / ( ax ay )] cw,r

with cw,r between 0.6 and 2.4, with mean value cw,r = 1.5.

Riparian Husbandry

Different vegetative species are expected to require different location and flow conditions. All of them are expected to provide vegetative cover to minimize the possibility of channel or bank erosion. For wood, the following practices are recommended:

  • Remove old and sick wood, particularly when they are an obstacle to the flow.
  • With existing vegetation, thin elements positioned in untypical locations.
  • If hydraulically insignificant, leave vegetative debris to encourage habitat (Fig. 37).

Sedges and shrubs should be cut only when hydraulically necessary. For lawns, the following practices are recommended:

  • Mow lawn of embankment once to twice per year.
  • During mowing, attention should be payed to bird eggs.
  • Some areas should be kept unmowed to conserve biodiversity.

Examples of vegetative debris

Fig. 37 (a)  Examples of vegetative debris.

Examples of vegetative debris

Fig. 37 (b)  Examples of vegetative debris.

Examples of vegetative debris

Fig. 37 (c)  Examples of vegetative debris.

5.5 Design of horizontal alignment

The design of the horizontal alignment of Arroyo Alamar has been accomplished following the current location of the streambed. It is understood that the stream will have a tendency to change its alignment with time. The proposed stream rehabilitation fixes the streambed in order to define the external limits of the project.

View of the proposed alignment

View of the proposed alignment.
View of the proposed alignment

View of the proposed alignment
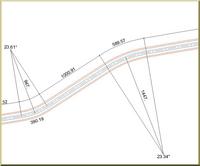
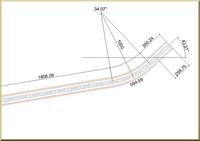
(large scale): A + B + C + D
View of the proposed alignment:A

View of the proposed alignment: A.
View of the proposed alignment:B

View of the proposed alignment: B.
View of the proposed alignment:C

View of the proposed alignment: C
View of the proposed alignment:D

View of the proposed alignment: D

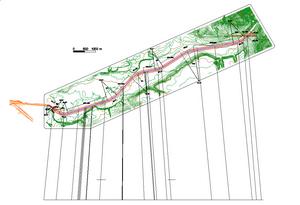
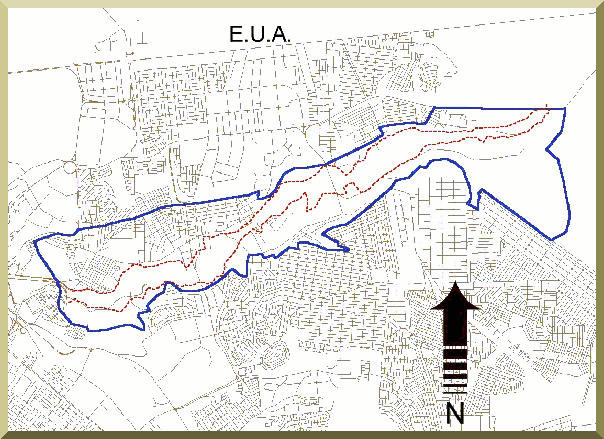
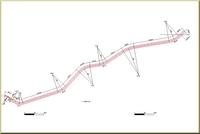
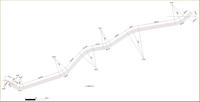
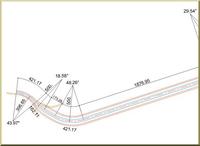
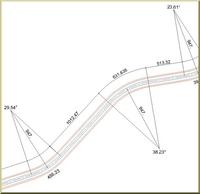
Fig. 38   Arroyo Alamar:  Detail of horizontal alignment.

5.6 Design of vertical alignment

This document contains an approximate calculation of the volume of granular materials (sand and gravel) that could be extracted from the Arroyo Alamar project if the channel were to be lowered. The rational for lowering the channel has several purposes:

  • To increase the channel conveyance.

  • To extract sand and gravel and commercialize it to support the project development.

  • To enhance the aesthetics of the channel design.

Figure 39 shows the horizontal alignment of the channel design in Arroyo Alamar. A vertical bed-level profile was obtained with AutoCAD, and used to calculate the volume of cut (removal of sand and gravel) from the bed (Fig. 40). Three cases were considered:

  • a. A uniform slope linking upstream and downstream end points (From Puente Cañon del Padre to Primera Etapa del Rio Tijuana).

  • b. A uniform slope at a depth of 1 m below the slope at a.

  • c. A uniform slope at a depth of 2 m below the slope at a.

Arroyo Alamar:  Horizontal alignment.

Fig. 39   Arroyo Alamar:  Horizontal alignment.

Arroyo Alamar:  Vertical alignment

Fig. 40   Arroyo Alamar:  Vertical alignment.

The following table summarizes the results of the analysis.

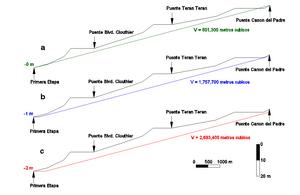
Table 11. Extractable volume of borrow materials from streambed of Arroyo Alamar.
Level
(m)
Volume
(m3)
-0801,300
-11,575,700
-22,693,400

An analysis has been performed to calculate volumes of sand and gravel mining as a result of rehabilitation of Arroyo Alamar. Results indicate that up to 2.7 million cubic meters can be obtained from the channel bed of Arroyo Alamar by lowering it 2 m.

5.7 Documentation of present conditions

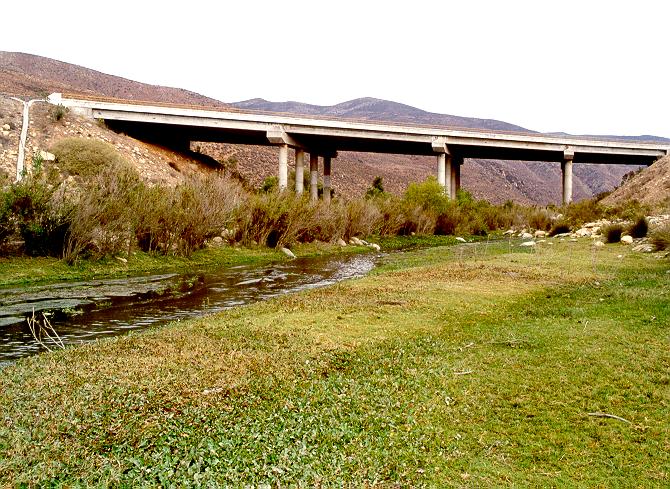
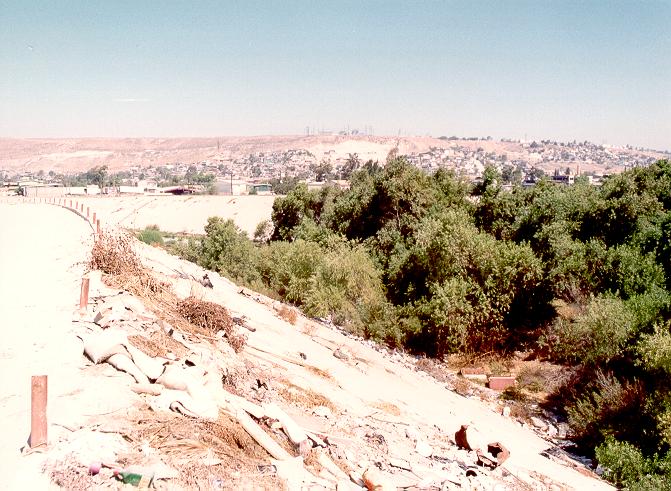
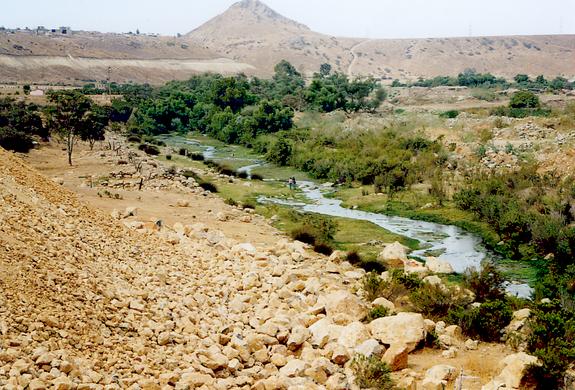
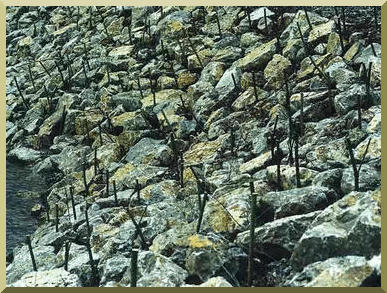
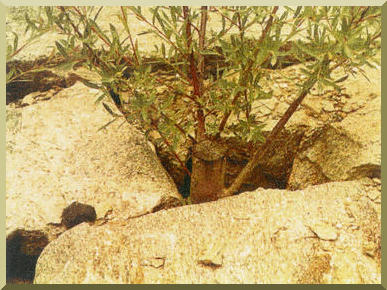
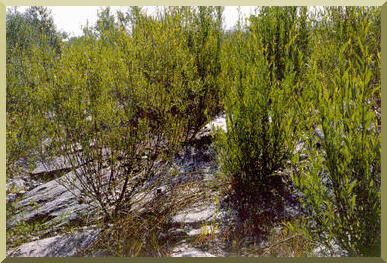
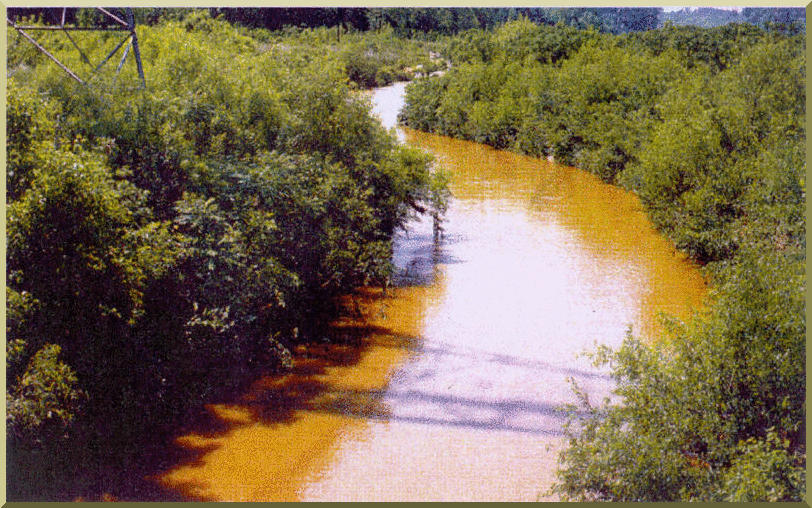
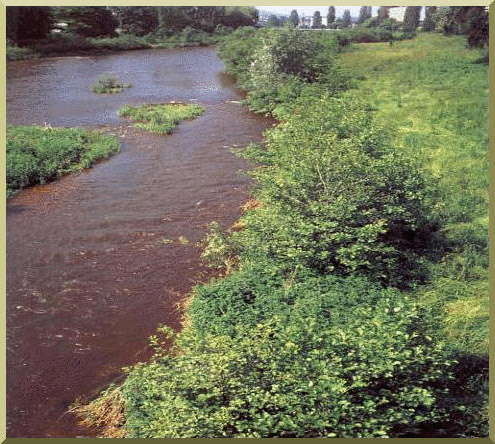
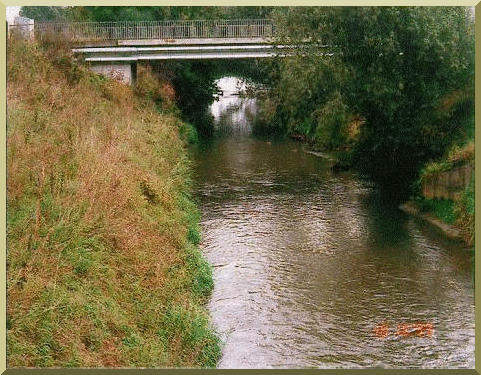
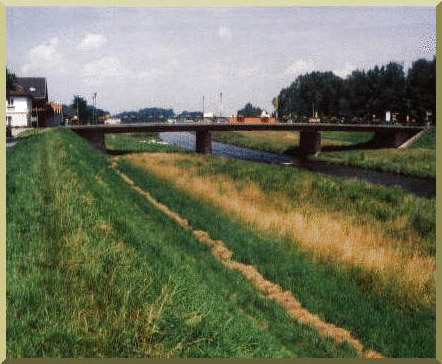
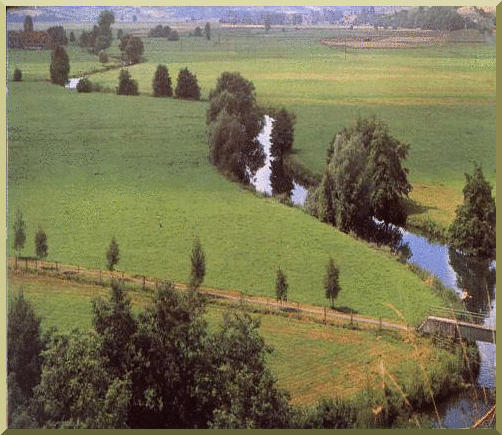
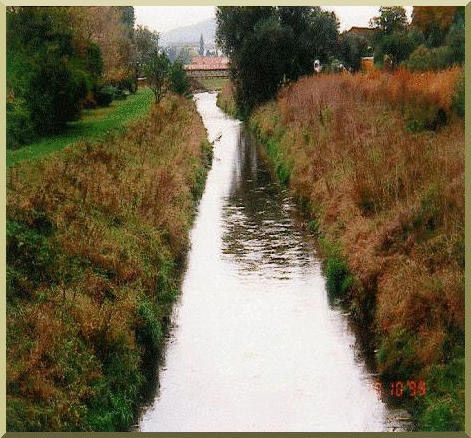
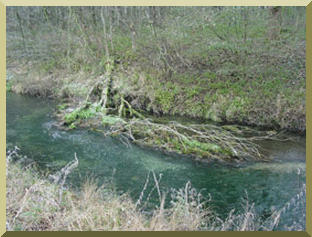
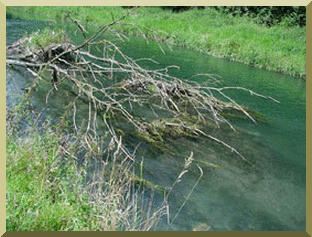
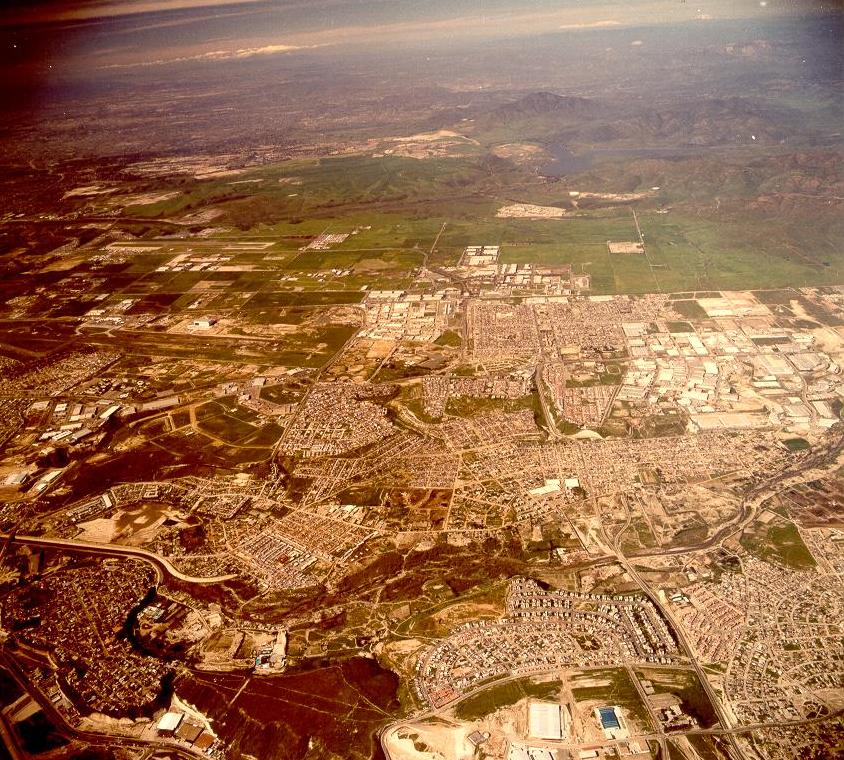
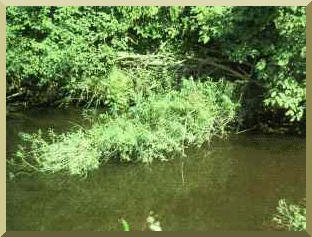
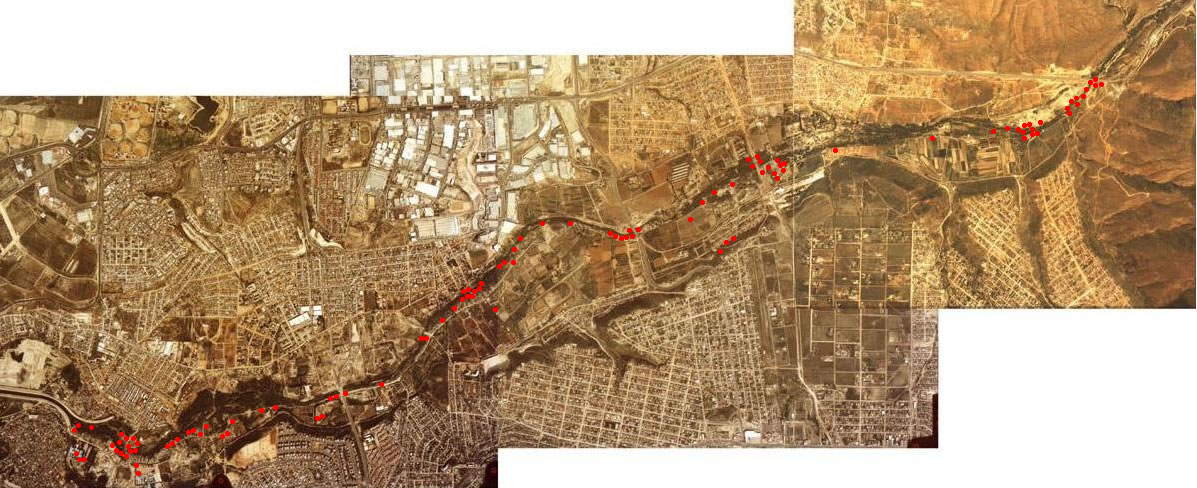
This study has performed a photographic documentation of the present conditions in Arroyo Alamar. Currently, Arroyo Alamar has a mixed use of irregular housing, recreation, light industry, agriculture, gargabe dumps, and other uses. The collection of 108 photographs portray the present conditions in the Arroyo Alamar on September 2002. The rehabilitation will change the look of the channel; therefore, it is necessary to document the present (baseline) conditions to establish the measure to which channel improvements have been accomplished at the conclusion of the project.

Present conditions in Arroyo Alamar

Fig. 41   Present conditions in Arroyo Alamar (Click to enlarge and display photos).

6. CONCLUSIONS

The following conclusions are obtained from this study:

  • A hydroecological design has been accomplished for the Arroyo Alamar. The design used the U.S. Army Corps of Engineers' HEC-RAS model to determine design flow depths, mean velocities, Froude numbers, and freeboards for a typical cross-section featuring a compound prismatic channel with left and right overbank side channels (Fig. 3).

  • Gabion systems are a compromise between riprap and concrete channels, and are applicable to the hydroecological rehabilitation of Arroyo Alamar.

  • The ecology and flora of Arroyo Alamar has been described and documented for project use.

  • Vegetative and gabion-lined systems have been documented for project use.

  • Horizontal and vertical design alignments have been accomplished. The use of the streambed of Arroyo Alamar as source of borrow materials (sand mining) has been examined.

  • The present conditions of Arroyo Alamar have been documented for use as baseline data on which to base future assessments of channel rehabilitation and restoration.

  • A website (http://proyectoalamar.org) has been developed to inform interested persons and the public at-large about project developments.

7. RECOMMENDATIONS FOR FURTHER RESEARCH

The following recommendations are offered for further research:

  • Arroyo Alamar should be developed in a sustainable way. For this purpose, the principles of sustainable river architecture should be taken into account. According to this principle, efforts should be made to design the flood plains for soft uses such as recreation, sports education, parking, and so on, following examples already available in Mexico (Atoyac river in Oaxaca and Santa Catarina river in Monterrey).

  • Every effort should be made to discourage, at all levels of government, the implementation of hard solutions such as concrete lining of the flood channel. This type of solution degrades the natural and social environment and negatively impacts a host of other channel uses, such as groundwater replenishment, riparian ecosystem health, biodiversity, and water quality. All over the world, streams and rivers are being restored, to the extent practicable, to their natural conditions. Therefore, any solution based on concrete channelization will represent a serious setback and cause irreparable harm to the local environment.

8. RESEARCH BENEFITS

The following research benefits have been identified:

  • The research has identified a practical and effective way to rehabilitate and restore the Arroyo Alamar following sound hydroecological principles. Over the course of several years, institutional neglect has allowed the Arroyo Alamar to degrade to such a serious state that attention is now of the essence. Currently, Arroyo Alamar is both an eyesore and a public health hazard, not to mention it being a haven for substandard settlements, severe risk of flood damage to life and property, and illegal trash dumping. The focus is currently on the rehabilitation, which will enable Arroyo Alamar to become a green area within Tijuana's city limits, a resource sorely needed for the social and economic well-being of the local population.

  • The research has provided the technical elements to persuade local officials and stakeholders to pursue the Arroyo Alamar rehabilitation along the principles of sustainable development. The research findings specifically discourage any solution based on concrete channelization, and encourages the hydroecological approach to river channelization. The latter is based on sound ecological and social principles, since in this way the river and its natural resources are preserved for the use and enjoyment of the local population, instead of being held hostage (not accessible for use by the local population) through a concrete channelization scheme.

9. ACKNOWLEDGMENTS

The authors wish to acknowledge the assistance of the following persons:

  • Ampar V. Shetty, research associate, San Diego State University.
  • Juan P. Nogues, student, University of Kansas, Lawrence, Kansas.
  • Andreas Koch, student, Magdeburg University, Magdeburg, Germany.
  • Flor Perez Martinez, student, Instituto Politecnico Nacional, Mexico City, Mexico.

10. REFERENCES

  • Barnes, H. A., 1967. Roughness characteristics of natural channels U. S. Geological Survey Water-Supply Paper 1849, Washington, D.C.

  • Bowler, A.P. 1990. Riparian woodland: an endangered habitat in Southern California. In: Endangered plant communities of Southern California. A.A. Schoenherr (ed.) Proceeding of the 15th Annual Symposium. California State University, Fullerton, California. Pp. 80-97.

  • Comisión Nacional del Agua, 1993. Cuenca Arroyo El Alamar, Tijuana, B.C., Estudio Hidrológico. Gerencia Estatal de Baja California, Subgerencia de Administración del Agua, Ensenada, B.C.

  • Comisión Nacional del Agua, 1994. Datos hidrológicos, Arroyo Alamar, Tijuana. Gerencia Regional de la Península de Baja California, Subgerencia Regional Técnica, Mexicali, B.C.

  • Chow, V. T. 1959. Open-channel hydraulics. McGraw-Hill, New York.

  • Delgadillo, J. 1998. Florística y ecología del norte de Baja California. 2da. Edición. Universidad Autónoma de Baja California. Mexicali, B.C., México. 407 pp.

  • Gregory, V.S., J.F. Swanson, A.W. McKee and W.K. Cummins. 1991. An ecosystem perspective of riparian zones. BioScience 41(8):540-551.

  • Instituto Municipal de Planeación, 1999. Propuesta Alternativa de Desarrollo para la Cuenca del Arroyo Alamar. City of Tijuana, Baja California, Mexico, November.

  • Kovalchik, B.L. and L.A. Chitwood. 1990. Use of geomorphology in the classification of riparian plant associations in mountainous landscapes of Central Oregon, USA. Forest Ecology and Management 33-34:405-418.

  • Ponce, V. M. 2001. Flood hydrology of the Binational Cottonwood Creek - Arroyo Alamar, California and Baja California. http://alamar.sdsu.edu

  • Reichenbacher, W.F. 1984. Ecology and evolution of southwestern riparian plant communities. Desert Plants 6(1):15-22.

  • Robichaux, R. 1980. Geological history of riparian forest in California. In: Riparian forest in California: their ecology and conservation. A. Sands (ed.). A Symposium Sponsored by Inst. of Ecol., University of California, Davis, Ma, 14 1977, Inst. Ecol. Pub. No. 15.

  • U.S. Army Corps of Engineers. 2002. HEC-RAS: River Analysis System. Release 3.1.1.

  • Warren, G.R. J. Greg and J. Major. A survey of riparian forest flora and fauna in California. In: Riparian forest in California: their ecology and conservation. A. Sands (ed.). A Symposium Sponsored by Inst. of Ecol., University of California, Davis, May, 14 1977, Inst. Ecol. Pub. No. 15.

  • Wiggins, L.I. 1980. Flora of Baja California. Stanford University Press. Stanford, California. 1025 pp.


040324