|
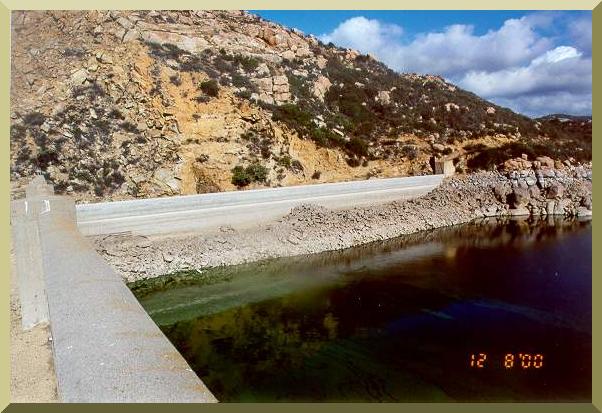
| Emergency spillway of Morena dam (40104). |
|
|
| Emergency spillway of Morena dam (40104). |
| Table B-6. Funtions of elevation - stored volume - spilled discharge for Morena reservoir.1 |
| Relative level (ft) | Absolute level (ft) |
Volume stored (acre-ft) | Spilled discharge (ft3/s) |
Absolute level (m) |
Stored volume (m3) |
Spilled discharge (m3/s) |
| 117.6 | 3000.0 | 11740. | 0. | 914.400 | 14481076. | 0.00 |
| 120.6 | 3003.0 | 13300. | 0. | 915.314 | 16405308. | 0.00 |
| 123.6 | 3006.0 | 15050. | 0. | 916.229 | 18563902. | 0.00 |
| 126.6 | 3009.0 | 17010. | 0. | 917.143 | 20981526. | 0.00 |
| 129.6 | 3012.0 | 19180. | 0. | 918.058 | 23658182. | 0.00 |
| 132.6 | 3015.0 | 21590. | 0. | 918.972 | 26630872. | 0.00 |
| 135.6 | 3018.0 | 24240. | 0. | 919.886 | 29899600. | 0.00 |
| 138.6 | 3021.0 | 27150. | 0. | 920.801 | 33489032. | 0.00 |
| 141.6 | 3024.0 | 30280. | 0. | 921.715 | 37349828. | 0.00 |
| 144.6 | 3027.0 | 33630. | 0. | 922.630 | 41481992. | 0.00 |
| 147.6 | 3030.0 | 37200. | 0. | 923.544 | 45885524. | 0.00 |
| 150.6 | 3033.0 | 41040. | 0. | 924.458 | 50622092. | 0.00 |
| 153.6 | 3036.0 | 45160. | 0. | 925.373 | 55704040. | 0.00 |
| 156.6 | 3039.0 | 49590. | 0. | 926.287 | 61168364. | 0.00 |
| 157.0 | 3039.4 | 50206. | 0. | 926.409 | 61928188. | 0.00 |
| 157.6 | 3040.0 | 51130. | 486. | 926.592 | 63067924. | 13.76 |
| 158.6 | 3041.0 | 52700. | 2117. | 926.897 | 65004492. | 59.95 |
| 159.6 | 3042.0 | 54300. | 4386. | 927.202 | 66978064. | 124.20 |
| 160.6 | 3043.0 | 55930. | 7145. | 927.506 | 68988640. | 202.32 |
| 161.6 | 3044.0 | 57580. | 10633. | 927.811 | 71023880. | 301.09 |
| 162.6 | 3045.0 | 59250. | 14283. | 928.116 | 73083800. | 404.45 |
| 163.6 | 3046.0 | 60950. | 18812. | 928.421 | 75180720. | 532.70 |
| 164.6 | 3047.0 | 62670. | 23246. | 928.726 | 77302304. | 658.25 |
| 165.6 | 3048.0 | 64410. | 28781. | 929.030 | 79448560. | 814.99 |
| 166.6 | 3049.0 | 66180. | 33944. | 929.335 | 81631824. | 961.19 |
| 167.6 | 3050.0 | 67980. | 40478. | 929.640 | 83852096. | 1146.21 |
| 168.6 | 3051.0 | 69800. | 46339. | 929.945 | 86097032. | 1312.17 |
| 169.6 | 3052.0 | 71650. | 53876. | 930.250 | 88378968. | 1525.60 |
| 170.6 | 3053.0 | 73520. | 60416. | 930.554 | 90685584. | 1710.79 |
| 171.0 | 3053.4 | 74300. | 63101. | 930.676 | 91647696. | 1786.82 |
| 1
The data in the first four columns was supplied by the Water Department of the City of San Diego.
|